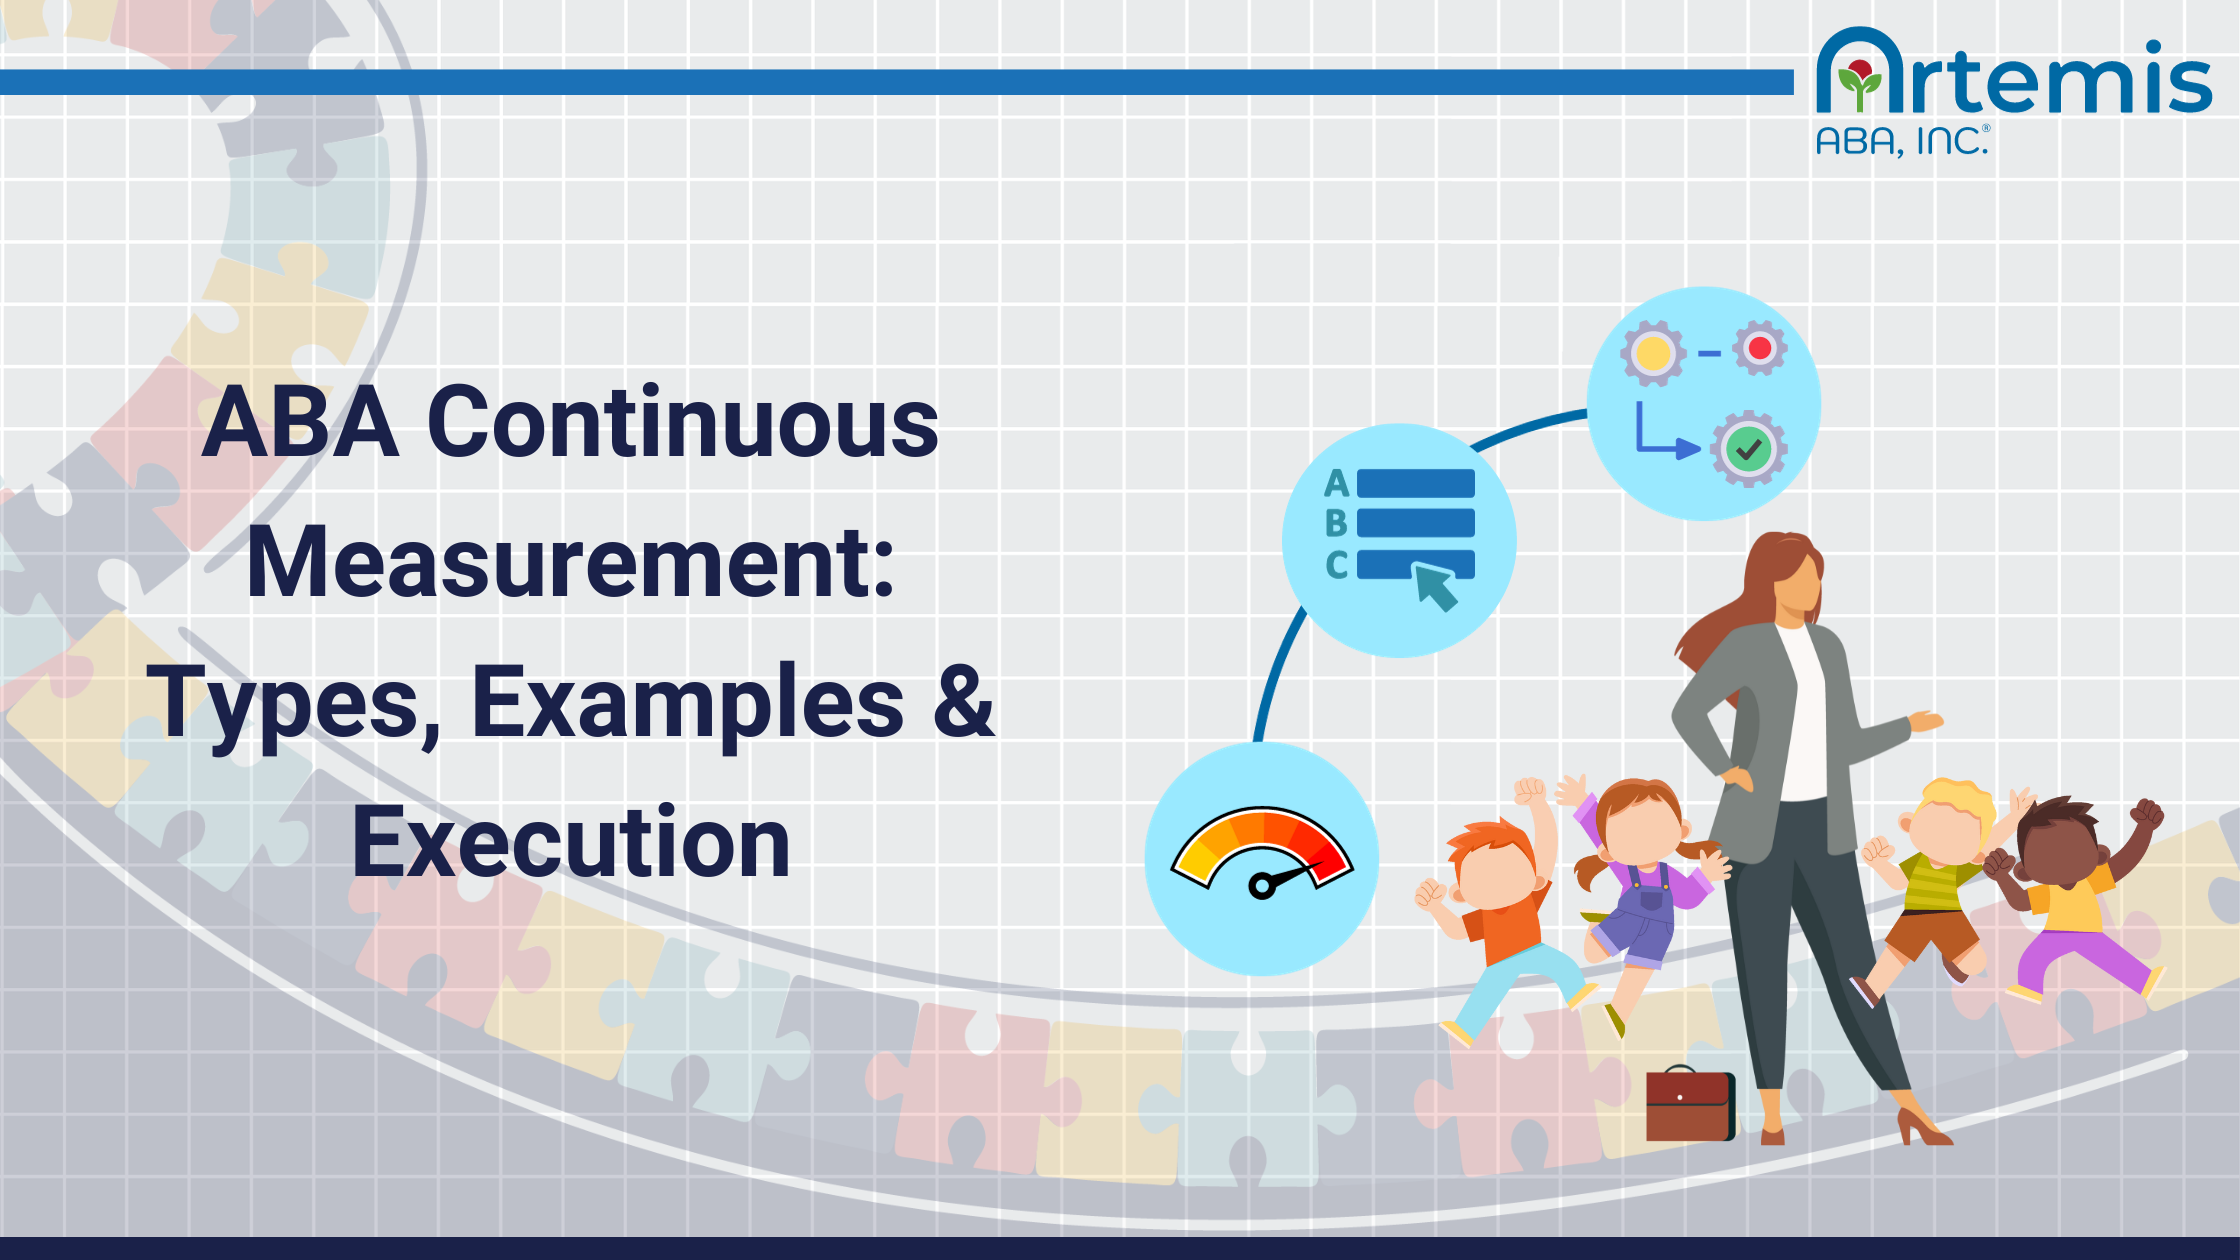
ABA Continuous Measurement: Types, Examples, and Data Collection

Inside this article:

Observing and measuring behavior is central to ABA. This guide shows how the practice of continuous data measurement reveals behavioral insights. Also, check out our free templates and resources, and learn when to apply each metric from ABA experts.

[fs-toc-omit]What Is Continuous Measurement in ABA?
Continuous measurement in ABA involves tracking a behavior over a specific time. For instance, counting how many times a child raises their hand in class is continuous. Continuous data is the most accurate way to gather insights into behavior.
Data collection is the core of Applied Behavior Analysis (ABA). BCBAs use data collection to actively observe and record behaviors, implement behavior intervention plans, and monitor a patient's progress. In essence, ABA relies on data collection to empower BCBAs in making informed, scientifically grounded decisions for the benefit of every patient. Data also helps BCBAs track intervention programs like discrete trial training.
In ABA, we categorize data into two types: continuous and discontinuous data. Continuous data means a BCBA observes and records behavior data continuously within a given period. For example, let's say a BCBA was tracking a student's temper tantrums. If they used continuous data recording, the BCBA would take data on the temper tantrums throughout the session.
In contrast, discontinuous data means the BCBA records data during specific intervals. In the same example, the BCBA would only record data about temper tantrums during these pre-defined intervals.

April Torres, M.Ed., BCBA, emphasizes the importance of using continuous data to understand a target behavior comprehensively. "Continuous data provides a complete and accurate picture of behavior," says Torres. "But, the data collector has to keep their attention on a single student, which isn't always possible."
Torres adds: "Continuous recording is the most effective and practical approach for monitoring relatively infrequent behaviors in a one-on-one setting."
Key Takeaways:
- Continuous data collection is one way for BCBAs to gain precise insights into behavior and evaluate the effectiveness of behavior intervention plans.
- Key continuous data measurements include frequency, duration, rate, latency, and inter-response time.
- When creating a data collection plan, it's crucial to establish clear goals and select metrics that align with your specific needs and circumstances.
- Experts recommend that you collect and analyze data electronically.
- Integrated practice management software programs streamline data collection and analysis while also managing various aspects of operating an ABA clinic.
Types of Continuous Measurement in ABA
The most common types of continuous measurements include frequency, duration, and rate. Latency and inter-response time are also continuous measurements but apply to fewer situations. These data all measure different aspects of behavior.
These data types have different use cases, ways to graph them, and pros and cons. The following sections detail each of these five types.
[fs-toc-omit]Frequency Data Collection in ABA
Frequency data measures how often someone engages in a specific behavior. It is a count of behavior instances that a data collector observes throughout a session. It provides information on how often a behavior occurs.
Frequency data is the best way to understand how often someone engages in a specific behavior. For example, if you want to know how often a child raises their hand to ask a question, you could use frequency data to record each instance when the child raises their hand.
"We also call frequency data a 'count' or 'even recording,'" Torres says. "Frequency data just refers to tracking whether a behavior occurs over a pre-defined time that usually doesn't change. We collect frequency data during class times or sessions that always last the same amount of time."
It's essential to note that the standard definition of the term 'frequency' conflicts with how BCBAs use these terms in practice. Most ABA textbooks define frequency as a count without considering a specific time interval. However, BCBAs interpret and analyze frequency data within the context of their session length. So, although technicians count observations without time in mind, they later factor in the time interval during analysis. This makes frequency data a "rate" or a count over time. However, it's important to note that "rate data" in ABA involves time intervals that may differ from the routine session or class length.
When to Collect ABA Frequency Data
You should collect frequency data:
- Whenever you want to track how often a child engages in a specific behavior.
- During sessions that always last the same amount of time.
- Whenever you're interested in reducing or increasing a behavior.
- If you're tracking a discrete behavior (that has a clear start and stop).
How to Visualize ABA Frequency Data
Graph frequency data by plotting the frequency on the y-axis and the date on the x-axis. You can add specific events, like the day you began an intervention, to understand whether your methods are working to reduce or increase the target behavior frequency.

ABA Frequency Data Categories and Examples
BCBAs use frequency data to measure different behavior categories. The main categories are sensory behavior, escape-based behavior, attention-based behavior, and tangible-based behavior.
Here are four examples of frequency data:
- Sensory behavior: The child repeated their stimming motion 15 times in today's session.
- Escape-based behavior: The child left the room without completing their task eight times during today's class.
- Attention-based behavior: The child shouted to gain the teacher's attention four times during today's session.
- Tangible-based behavior: The child raised their hand to request their favorite toy seven times during today's session.
Frequency data is an incredibly valuable metric in behavior analysis, but it's not always the best choice. The next sections cover its pros and cons.
Pros and Cons of ABA Frequency Data
The pros of ABA frequency data start with being straightforward to measure, analyze, and visualize. The cons include the time demand on the data collector, its lack of application to indiscrete behaviors, and the limited context it provides.
Pros
- Ease of measurement: Collecting frequency data is typically straightforward. You tally each instance of the behavior on a dedicated datasheet or software program. You also don't need to measure the observation time because we record frequency data during sessions of consistent duration. Instead of timing the observation, you just need to note the session length.
- Ease of analysis: Analyzing frequency data is also straightforward. It offers a clear count of behavior occurrences, making it easy to interpret.
- Versatility: Frequency is a versatile metric that helps BCBAs understand diverse types of behavior. It can be critical in informing a BCBA if a behavior requires an intervention.
- Easy to represent visually: Creating and sharing a frequency graph can be a great way to share insight with other ABA professionals or stakeholders like the child's parents or the child.
- Provides critical insight into the severity of a behavioral issue: Evaluating the frequency of a behavior is one of the first steps a BCBA will take to determine if the behavior requires intervention. For example, throwing a temper tantrum once a week is less concerning than throwing temper tantrums several times a day.
Cons
- Time and focus demand: Collecting frequency data demands the BCBA's undivided attention. That's not always practical.
- Impractical for indiscrete behaviors: Frequency data can be challenging to measure for indiscrete behaviors without a clear start and stopping point. An example of indiscrete behavior is continuous nail-biting. In such cases, there's no distinct beginning or end to each nail-biting instance, so counting the frequency proves challenging.
- Provides limited context: While frequency data provides information about how often a behavior occurs, it may lack the context necessary for a comprehensive understanding of the behavior and its triggers. If you want to collect frequency data, explore our free datasheet. This resource provides a straightforward template designed for the effortless recording of frequency data. Download it now and simplify your data collection process.

[fs-toc-omit]Rate Data Collection in ABA
Rate data collection measures how often someone engages in a behavior over a specific time interval. The specific definition of "rate" is count over a period of time. It's like counting frequency, except that the time interval isn't always the same.
The terms "rate recording" and "frequency recording" are very similar. The two differ only in how they consider time and the specific situations in which BCBAs opt for one over the other.
"Frequency, technically speaking, is essentially just a count of occurrences," notes Torres. "However, in practical terms, we often treat it as 'rate-by-default' data because we consistently collect frequency data during routine sessions or classes with fixed durations. Since we already know the session length, we don't need to actively keep track of time while collecting this data. Nevertheless, during data analysis, we are essentially considering the behavior's frequency over the session's duration, which is akin to rate—a count over time."
Torres goes on to clarify the distinction with rate data: "Conversely, when we measure frequency within a narrower time interval, one that doesn't neatly align with the session's length, we must be more attentive to timing. In ABA, we refer to this as 'rate' data, and we typically gather it in more specific, specialized contexts than frequency data."
When to Collect ABA Rate Data
Certain ABA cases naturally lend themselves to rate data. You should collect rate data in the following situations:
- Whenever you want to track how often a child engages in a specific behavior during a time interval that's not the same as the typical session length
- If you're recording data on self-injurious behavior, which would be unethical to allow the child to continue during the entire session
- If you're tracking a discrete behavior (that has a clear start and stop)
- If you're interested in the trends of a behavior. For example, collecting rate data at different times of the day will inform you when the behavior occurs most frequently, or if specific circumstances trigger it
How to Graph Rate Data
Most BCBAs graph rate data as part of a behavior intervention plan or a report to insurance payers. Plot the observation dates on the x-axis, and the average rates on the y-axis. It's more accurate if you only plot rates that technicians measured with the same time interval.

Examples of ABA Rate Data
Here are examples of rate data from the four behavior categories.
- Sensory behavior: The child repeated their stimming motion 20 times over a one-hour observation period. The rate is 15 instances/60 minutes.
- Escape-based behavior: The child left the room without completing the task eight times during a 30-minute quiet work period. The rate is eight instances/30 minutes.
- Attention-based behavior: The child shouted to gain the teacher's attention four times within a 45-minute session today. The rate is four instances/45 minutes.
- Tangible-based behavior: The child raised their hand to ask for a snack seven times during a 90-minute observation period. The rate is seven instances/90 minutes.
Pros and Cons of Collecting ABA Rate Data
The main pros of collecting ABA rate data are its precision, sensitivity to change, and trend insights. Its main cons are that it's resource-intensive and not useful for indiscrete behaviors.
Here's a more detailed look at the advantages and disadvantages of rate data in ABA:
Pros:
- Precision: Rate data allows for a more precise behavior analysis by considering the frequency of occurrences within specific time intervals. This precision can provide a better understanding of behavior patterns.
- Sensitive to change: Rate data is often more sensitive to changes in behavior than frequency data. This sensitivity makes it a valuable tool for tracking progress or the effectiveness of interventions.
- Helps identify behavior trends: By examining behavior in specific time intervals, practitioners can identify trends, such as when a behavior occurs most frequently or if patterns relate to the time of day or circumstances.
- Suitable for diverse behaviors: Rate data can be measured for any discrete behavior.
- Easy to represent visually: Creating and sharing a frequency graph can be a great way to share insight with other ABA professionals or stakeholders like the child's parents.
- Provides critical insight into the severity of a behavioral issue: Evaluating the frequency of a behavior is one of the first steps a BCBA will take to determine if the behavior requires intervention. For example, throwing a temper tantrum once a week is less concerning than throwing temper tantrums several times a day.
Cons:
- Resource-intensive: Collecting rate data can be more resource-intensive than frequency data because it requires more precise time measurements.
- Impractical for indiscrete behaviors: Like frequency data, rate data will be difficult to measure for indiscrete behaviors that don't have a clear start and stop.
- Can be complex to analyze: Analyzing rate data can be more complicated, especially when dealing with irregular or inconsistent time intervals. This complexity can make it challenging to interpret the data. Try our convenient and user-friendly data sheet to record rate data.
ABA Rate Data Sheet

[fs-toc-omit]Duration Data Collection in ABA
Duration data in ABA measures how long a patient engages in a specific behavior. ABA professionals use duration data to track behaviors with a clear start and end. In continuous data recording, data collectors record duration data continuously during a session.
In ABA, duration data measures how long a defined instance of behavior lasts. Duration data is very helpful when we're wondering how long a child engages in a specific behavior. This information can be incredibly informative for a BCBA who wants to assess or monitor a behavior.
"Measuring the duration of behavior serves as a pivotal diagnostic tool for identifying problematic behaviors and evaluating the effectiveness of behavior intervention plans," explains Torres. "It's useful across all phases of behavioral management, from the early stages when we assess whether a behavior is problematic to the intervention stage."
When to Collect Duration Data
You should collect ABA duration data:
- Whenever you want to understand how long a behavior lasts.
- When the target behavior is discrete (has a clear beginning and ending.
- When you want to assess the intensity of the behavior.
- If you have enough time to closely track an individual child's behavior.
How to Graph ABA Duration Data
To graph duration data, plot durations on the y-axis and time on the x-axis. A duration data graph will help you visualize patterns and identify changes in behavior length.

Examples of ABA Duration Data
You can use duration data in ABA across all four major behavior categories. Here are some examples of duration data:
- Sensory behavior: The child engaged in 30 minutes of repetitive stimming in today's session.
- Escape-based behavior: The child engaged in a temper tantrum for five minutes to avoid completing a task.
- Attention-based behavior: The child called the teacher for two minutes to gain attention.
- Tangible-based behavior: The child played with a toy for seven minutes.
Pros and Cons of Duration Data in ABA
The main pro of using ABA duration data is that it's useful in various contexts. However, the con is that it requires that the data collector focus their attention on one child.
Pros:
- Ideal for discrete behaviors: Duration data is perfect for any behavior with a distinct beginning and end.
- Provides insight into frequency: By calculating duration data, you gain an insight into behavior frequency. For instance, if you measure the duration of two behavior instances in a session, you can also calculate the frequency by simply counting the number of observations. In this case, the student engaged in the behavior twice.
- Provides insight into intensity: Duration recording also gives insight into intensity. Generally, the greater the duration, the more intense its behavior. For instance, spending 10 minutes engaged in self-injurious behavior is more intense than spending 30 seconds engaged in self-injurious behavior.
Cons:
- Demands undivided attention from the data collector: To record duration data continuously and accurately, the data collector must observe behavior from start to finish.
Difficult to use for indiscrete behavior: Collecting duration data for indiscrete behaviors may be difficult. For instance, measuring the duration of continuous vocalizations would be challenging because the behavior lacks a distinct starting and stopping point. Explore our free duration datasheet. This resource provides a straightforward template to simplify your data collection process.
ABA Duration Data Sheet

[fs-toc-omit]Latency Data Collection in ABA
Latency data in ABA measures the time it takes for a patient to begin a behavior after a specific prompt. ABA professionals use latency data to understand how long it takes the child to engage in behavior after a prompt.
"Latency data is like a timer for behavior," Torres says. "Latency data precisely gauges response times to tasks or requests, making it an invaluable tool for establishing baseline measurements and evaluating the effectiveness of behavior interventions."
Latency recording focuses on a patient's response time. To take latency data, a collector gives a prompt for a behavior, which we also call an "antecedent." Then, they record the time it takes for the child to respond to the prompt with the target behavior. For instance, if a BCBA wants to know how long it takes for a student to respond to a prompt, they would use latency data. When combined with duration data, latency data provides a holistic view of temporal behavior patterns.
When to Use Latency Data in ABA
You should use latency data in ABA in the following situations:
- Whenever you want to record response times precisely: If you're engaging in activities that require a quick response, like following classroom instructions or safety protocols.
- As part of a behavior intervention plan designed to increase behavior: "Latency data proves incredibly valuable when aiming to enhance or increase specific behaviors," notes Torres. "For instance, consider a child who typically takes a long time to sit down and start eating dinner. If you're implementing an intervention plan to address this behavior, latency data becomes essential. It helps track whether the latency is decreasing and the child is improving."
How to Graph Latency Data in ABA
Most BCBAs choose to graph the average latency per session date.

Examples of ABA Latency Data
Here are four examples of latency data across the major behavior categories.
- Sensory behavior: Antecedent: Present sensory toy (spinning top). Latency: 15 seconds.
- Tangible-based behavior: Antecedent: Offer a preferred toy. Latency: 10 seconds.
- Attention-based behavior: Antecedent: Begin math class activity. Latency: 20 seconds.
- Escape-based behavior: Antecedent: Provide instructions to begin math homework. Latency: 2 minutes.
Latency data isn't as common as duration or frequency data, but collecting latency data can be critical for understanding certain behaviors.
Pros and Cons of Latency Data in ABA
Latency data's main benefit is measuring how long it takes the student to respond to a key prompt. However, it can be hard to record it accurately, and it doesn't apply to all behaviors.
Here are the details.
Pros:
- Precise measure of response time: Latency data accurately measures the time it takes for an individual to respond to a specific antecedent.
- Useful for behavior assessment: Latency data is valuable for assessing behaviors where the time it takes to initiate a response is critical, such as measuring prompt compliance or assessing the effectiveness of interventions.
- Assists in intervention planning: It aids in designing effective behavior intervention plans by highlighting areas where response times can be improved, contributing to better outcomes.
Cons:
- Can be difficult to record accurately: Collecting accurate latency data relies on the observer's precision in starting and stopping the timer precisely when the behavior begins, which can be challenging.
- Not suitable for all behaviors: Latency data mostly applies to behaviors with clear start and stop points, making it less ideal for continuous or ambiguous behaviors.
- Resource-intensive: Recording latency data can be resource-intensive, requiring constant observation and measurement, potentially limiting its practicality in some settings.
Explore our free latency data sheet to begin collecting response time data.
ABA Latency Recording Template

[fs-toc-omit]Inter-response Time (IRT) in ABA
Inter-response time (IRT) tracks how long it takes for a child to resume the same behavior after stopping it. For instance, it measures the time from the end of one tantrum to the start of another tantrum.
IRT data is useful when you want to measure how much time elapses between two consecutive instances of behavior. Specifically, a BCBA measures IRT from the end of the first behavior to the beginning of the second, and so on. Another way to think about IRT is that it measures the time between two of the same behaviors.
"We typically turn to IRT analysis when our objective is to precisely define behavior," Torres explains. "For instance, let's consider a scenario where a child exhibits temper tantrums throughout the day. However, upon closer observation, it becomes evident that there are only three distinct tantrum episodes. Between these episodes, there are brief pauses that a technician might mistakenly interpret as the start of a new tantrum. In such cases, employing IRT measurements aids us in establishing the specific time interval required to differentiate one instance of behavior from another."
When to Use IRT Data (inter-response time)
You should use inter-response time (IRT) data in the following ABA situations:
- Defining behavioral episodes: As mentioned earlier, IRT is useful for determining the boundaries of distinct behavioral episodes. For instance, when a child displays frequent tantrums, IRT analysis can help identify when one tantrum episode ends and another begins by examining the time gaps between tantrum behaviors.
- Assessing habitual patterns: IRT can be employed to understand the regularity or irregularity of certain behaviors.
- Evaluating reinforcement schedules: In behavior analysis and operant conditioning studies, IRT can be used to evaluate the effects of different reinforcement schedules on response patterns.
Examples of IRT in ABA
Here are four examples of how IRT applies to each behavior function.
- Sensory-based behavior: On average, the child pauses for 20 seconds between instances of hand flapping.
- Escape-based behavior: On average, a child takes two minutes between instances of disruptive behavior.
- Attention-based behavior: A child has an IRT of one minute between attention-seeking temper tantrums.
- Tangible-based behavior: The child starts playing with a toy three minutes after presenting the toy.
Pros and Cons of Inter-Response Time (IRT)
The big pro of IRT is that it's useful when trying to understand behavior. The main con is its limited applicability.
Pro:
- Helps tailor custom interventions: IRT data can lead to highly individualized behavior intervention plans tailored to the specific needs and patterns of the individual.
Cons:
- Limited applicability: IRT may not be suitable for all behaviors or situations, as it is most effective when there is a clear start and end to behaviors.
- Can be difficult to record: Calculating and interpreting IRT data can be more complex than other measurement methods, requiring specialized training. Collecting and analyzing IRT data may require more time and resources than simpler measurement methods.
Recording IRT data can be complex. Try using our free data sheet template to get started.
ABA IRT Recording Template

ABA Continuous Data Cheat Sheet
Continuous data collection involves many metrics and methods. Whether you're a seasoned pro or a new student, our single-page cheat is a handy reference that breaks down every continuous data metric.
Get at-a-glance definitions, examples, pros and cons, and insights on when to utilize each metric, either for use in your clinic or as prep for your next RBT exam.

How to Implement Continuous Measurement in ABA
To measure continuous data effectively, assess your available resources and define your ultimate goals. This approach will help you decide which variables to measure. Well-planned data collection and analysis will lead to the best outcomes.
"Deciding what and when to measure is a critical part of creating effective intervention plans and providing the best quality of care," Torres emphasizes. "Data helps us understand which behaviors we need to prioritize and whether our plans are working. Ultimately, it comes down to your goal. For example, a BCBA hoping to establish baseline measurements for a discrete behavior may opt for completely different metrics and data collection methods than a BCBA hoping to reduce self-injurious behaviors."
Success hinges on selecting the right metric and method for the job when incorporating continuous measurement techniques into ABA practices.
Factors in Implementing Continuous Measurement in ABA
- Student's personality and abilities:
Consider the student's abilities and any potential challenges. Ensure the chosen measurement method is feasible and suitable for the student's age, developmental level, and skillset. - The specific behavior:
The nature of the behavior itself plays a pivotal role in determining the most suitable data collection metric and method. For instance, discrete behaviors, such as temper tantrums or raising a hand, call for distinct metrics compared to indiscrete behaviors. - Behavior context:
Analyze the settings and situations in which the behavior occurs for that student. Factors such as the classroom environment or home setting can influence the choice of metrics and data collection methods. - Resources for data collection:
Assess the amount of time and energy you have available for data collection. Consider the practicality of the chosen metric and method in relation to your schedule, resources, and staff availability. Select an approach that aligns with your capacity for consistent and accurate data collection. - Data interpretation:
Consider how the collected data will be interpreted and used to inform interventions. Make sure the chosen metrics provide meaningful information for decision-making.
Tips for Choosing the Right ABA Metric
After factoring in the child's specific needs, your available resources, and other overarching considerations, it's time to delve deeper into your goals. Here are some valuable tips on how to select the most appropriate metric based on your objectives.
Best Practices for ABA Continuous Data Recording Procedures
Data recording best practices help you collect high-quality data. Some best practices include training data collectors and recording data electronically. It's also important to clearly define the behavior.
Experts recommend these key best practices for recording continuous data in ABA.
- Quality-control your data.
"Maintaining data quality is non-negotiable," stresses Torres, BCBA. "Make sure to regularly review and validate your data and data that your staff takes on your behalf." - Scrutinize operational definitions.
Operational definitions provide clarity on what constitutes the target behavior. They must be crystal clear and devoid of ambiguity. "They serve as the foundation for consistent data collection," notes Torres. - Provide training to any data collector.
Proper training of data collectors is essential to maintain data accuracy and consistency. Thoroughly educate your team on data recording procedures, measurement techniques, and performance expectations." Well-trained collectors are more likely to yield accurate and reliable data. - Make sure you select the right metric for your behavior.
Selecting the right metric (e.g., frequency, rate, duration, latency, IRT) is crucial as it directly influences the type of data you collect and the insights you gain. As Torres advises, "Selecting the appropriate metric is a strategic decision. Tailor your metric choice to the behavior and question or goal at hand." - Use electronic data.
Electronic data collection tools offer several advantages over traditional paper-and-pencil methods. They improve data accuracy, streamline data management, and enable real-time analysis.
Using Electronic ABA Data Collection for Continuous Data
Electronic data collection reduces the time and energy it takes to collect continuous data accurately. BCBAs use the software to collect, graph, and analyze data. It also minimizes human error.
"I recommend that any BCBA or RBT take continuous data electronically," Torres says. "Collecting that data requires a lot of time and attention, and it can be hard to collect accurate data in a timely manner. Plus, keeping track of the data, reporting it, and graphing at the end of the session drains resources from the clinic. Outsourcing much of those tedious tasks to software is incredibly helpful."
These programs streamline continuous data gathering, making it more accurate and efficient. However, not all programs are created equal. Some may lack features like rate and latency data setup or a notes column, which is crucial for diverse data collection methods.
When choosing a data collection program, make sure it includes the following features:
Artemis Offers Comprehensive, Integrated ABA Data Collection
The quality of your data reflects the quality of your care. Artemis' integrated software handles the tedious aspects of data so you can focus on observing and understanding behavior. Artemis supports every aspect of ABA so you can provide the best quality care possible.
Understanding and evaluating continuous measurement data plays a crucial role in monitoring clients' progress. Artemis ABA software offers a comprehensive solution that allows you to conveniently record all types of continuous data measurements in a single platform. You can instantly graph the data and generate analysis reports to share the results with the child, their parents, and any other stakeholder.
This streamlined approach provides easy access for quick analysis and visualization of your data, ensuring a seamless experience for users. The software allows ABA therapists to effectively utilize the collected data to monitor client development and make well-informed treatment decisions.
As part of an integrated practice management software, Artemis' data collection is just one facet of its comprehensive support. Artemis takes care of the time-consuming administrative tasks, allowing you and your staff to focus on delivering the high-quality care that truly matters.
Schedule Your Walkthrough

Frequently Asked Questions
What is continuous measurement in ABA?

Continuous measurement is a data collection method in which every instance of a behavior is recorded throughout the observation period.
Why is continuous measurement important in ABA?
Continuous measurement provides the most accurate picture of behavior, which supports precise treatment decisions and stronger clinical outcomes.
What are the main types of continuous measurement in ABA?
The main types are frequency or event recording, rate, duration, latency, and interresponse time.
When should continuous measurement be used in ABA sessions?
Continuous measurement should be used when behaviors are clearly defined, observable, and feasible to track for the full session.
What are common challenges with continuous measurement?
Common challenges include staff fatigue, missed data during busy sessions, and inconsistent recording without clear systems in place.
How does Artemis ABA support continuous measurement in ABA?
Artemis ABA enables real-time data capture for all continuous measurement types and automatically converts session data into accurate graphs for faster clinical decisions.
Monday to Friday, 7 AM – 7 PM CST.
If you're reaching out outside these hours, please submit a support ticket—our team will respond as soon as possible.


%201.webp)