Using Cumulative Records in ABA: Examples, Implementation and Tracking Sheet

Inside this article:

Learn how to graph and read cumulative records in ABA. Find out when they work best, see examples, and get practical tips from BCBAs on how to analyze them. Discover how to use them in your practice, and start today with our free tracking tool.
Executive summary:
This guide explains how to use cumulative records in ABA to track skill growth over time. It covers what cumulative records are, their history, key elements, and how to interpret slope and acquisition rate. You’ll see practical examples, step-by-step setup instructions, and tips for sharing graphs with parents and insurers. The article also compares cumulative records to line graphs, explains when each is best, and includes a free tracking template, along with guidance on using digital ABA software to streamline graphing and reporting.
[fs-toc-omit]Role of the cumulative record approach in ABA
In Applied Behavior Analysis (ABA), a cumulative record is a graph that shows the running total of how many times a behavior occurs over time. ABA professionals use cumulative records to track learning patterns, share progress, and see how quickly a learner is gaining new skills.
Across industries, professionals use cumulative records, or “running total graphs,” to show how a variable's value accumulates over time. For example, public health agencies used cumulative case counts during the COVID-19 pandemic to report the total number of confirmed infections. The values in these graphs never decrease because each new data point adds to the previous total.
In ABA, Board Certified Behavior Analysts (BCBAs) and Registered Behavior Technicians (RBTs) use cumulative records to chart the running total of a specific behavior or skill a learner performs over time.
For instance, a cumulative record may show the number of assignments a student completes correctly, the number of new vocabulary words they know, or the total number of targets they master. BCBAs visually analyze the graph to understand the learner’s acquisition rate of new skills (how fast they are learning or mastering a skill), track steady progress toward long-term goals, and maintain a clear, data-based record of the learner’s growing “skill bank” over time.
Beyond clinical use cases, cumulative records are also a common way for BCBAs to communicate progress to insurance providers.

“Insurance providers expect to see measurable progress within a defined treatment period,” explains Dr. April Haas, BCBA-D, LBA-TX. “To demonstrate that progress, teams often use a master cumulative record graph that shows how many skills a learner has mastered over the course of treatment. Rather than graphing a single skill or behavior, this type of graph displays the running total of mastered behaviors for each learner.”
Combining a PhD in Educational Psychology with over 17 years of front-line clinical experience, Dr. Haas is motivated by continually improving behavioral health standards and specializes in high-fidelity assessment, program development, and data-driven optimization.
She describes how these “mastered target” graphs function in practice:
“For example, a learner might have 20 behavioral skill sets within a treatment plan, each with its own mastery criteria. One skill might be sitting at a table quietly for ten minutes, with mastery defined as maintaining that duration across consecutive sessions at 90 percent success. Another goal might involve learning 100 new words. When the learner meets the mastery criteria for a specific behavior, the team adds a data point on the corresponding date.”
She explains that mastered-target cumulative records are incredibly important in renewing authorizations because they are easy to interpret and clearly show growth over time.
“Insurance reviewers can quickly see how many behaviors the learner has mastered, which makes it easy to show that the services are working,” says Dr. Haas. “When the cumulative graph shows steady growth, the progress speaks for itself.”
Elements of an ABA cumulative record
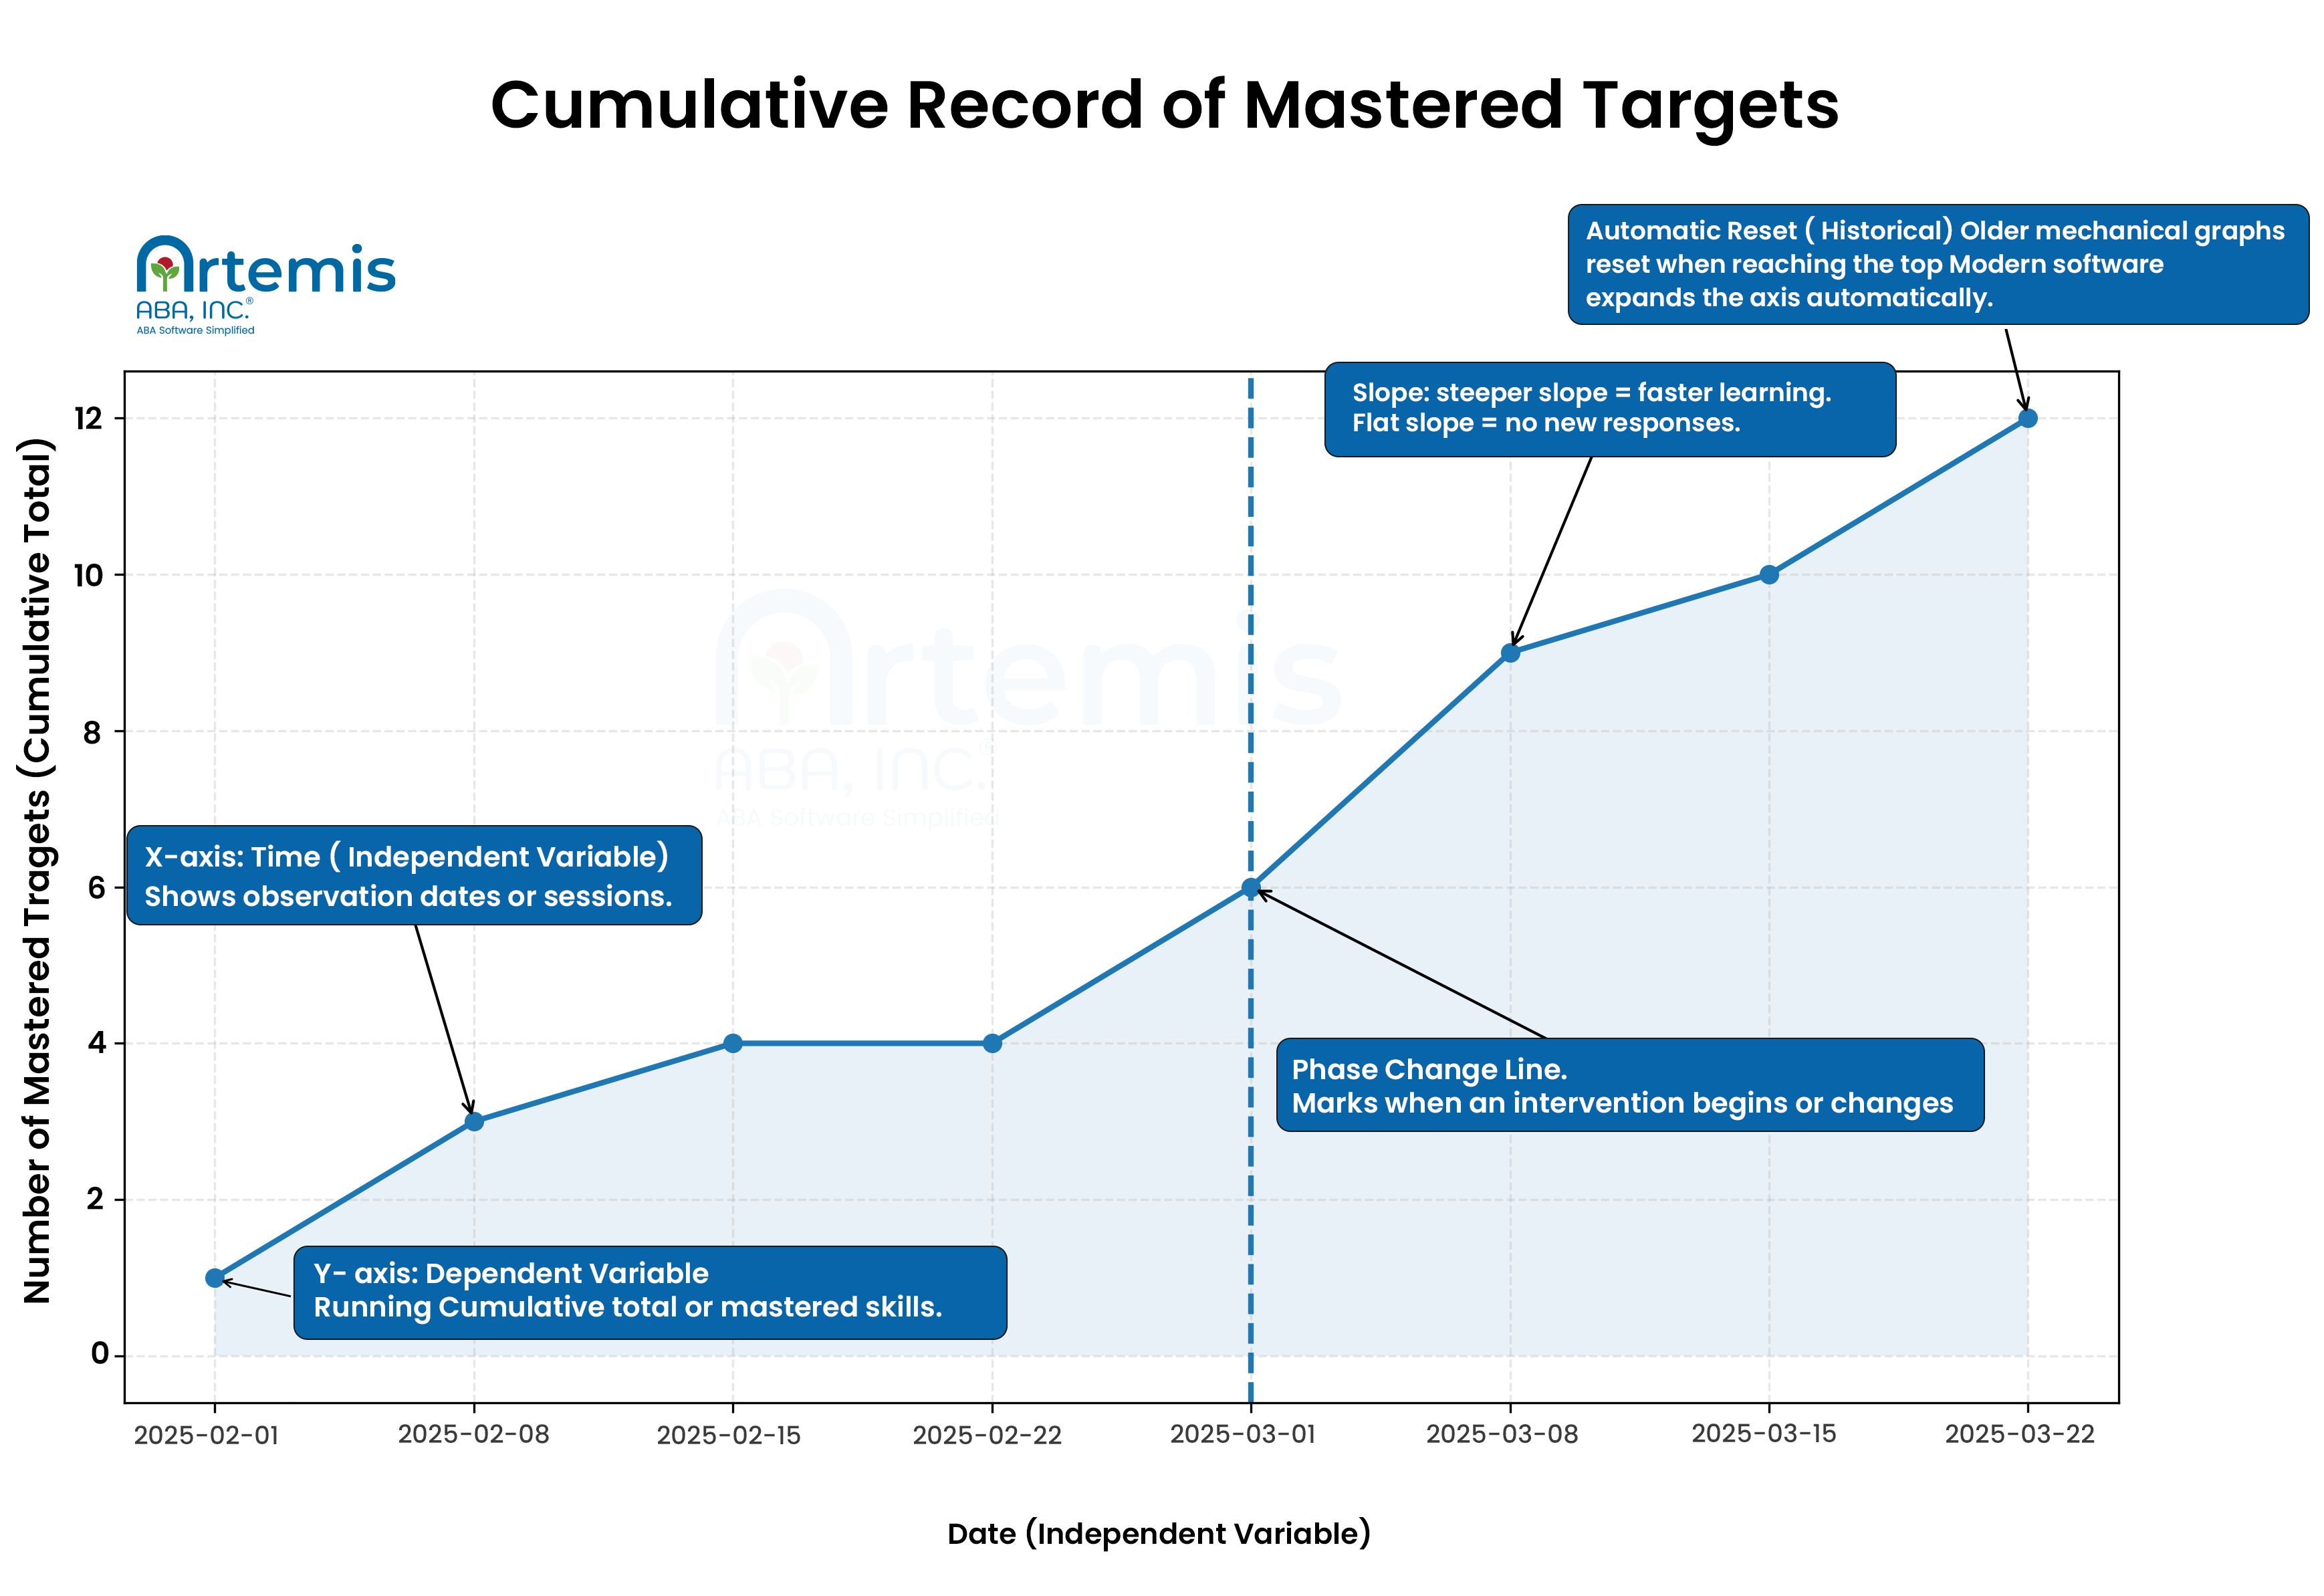
An ABA cumulative record graphs time on the x-axis and the total number of responses on the y-axis. Each point adds the session’s responses to the previous total. The line rises or stays flat but never decreases. BCBAs examine the slope to evaluate response rate and behavior change.
Here’s a breakdown of the elements in an ABA cumulative record:
Examples of ABA cumulative record graphs
These examples show how ABA cumulative records can clearly show how a learner develops a new skill or replacement behavior. Teams use them to count mastered targets and demonstrate overall progress within a program. The examples also show how cumulative records make progress easy to see and help teams clearly share results.
Here are three examples that highlight the most common data that ABA practitioners visualize with cumulative records.
Example of an ABA cumulative record graph for skill acquisition
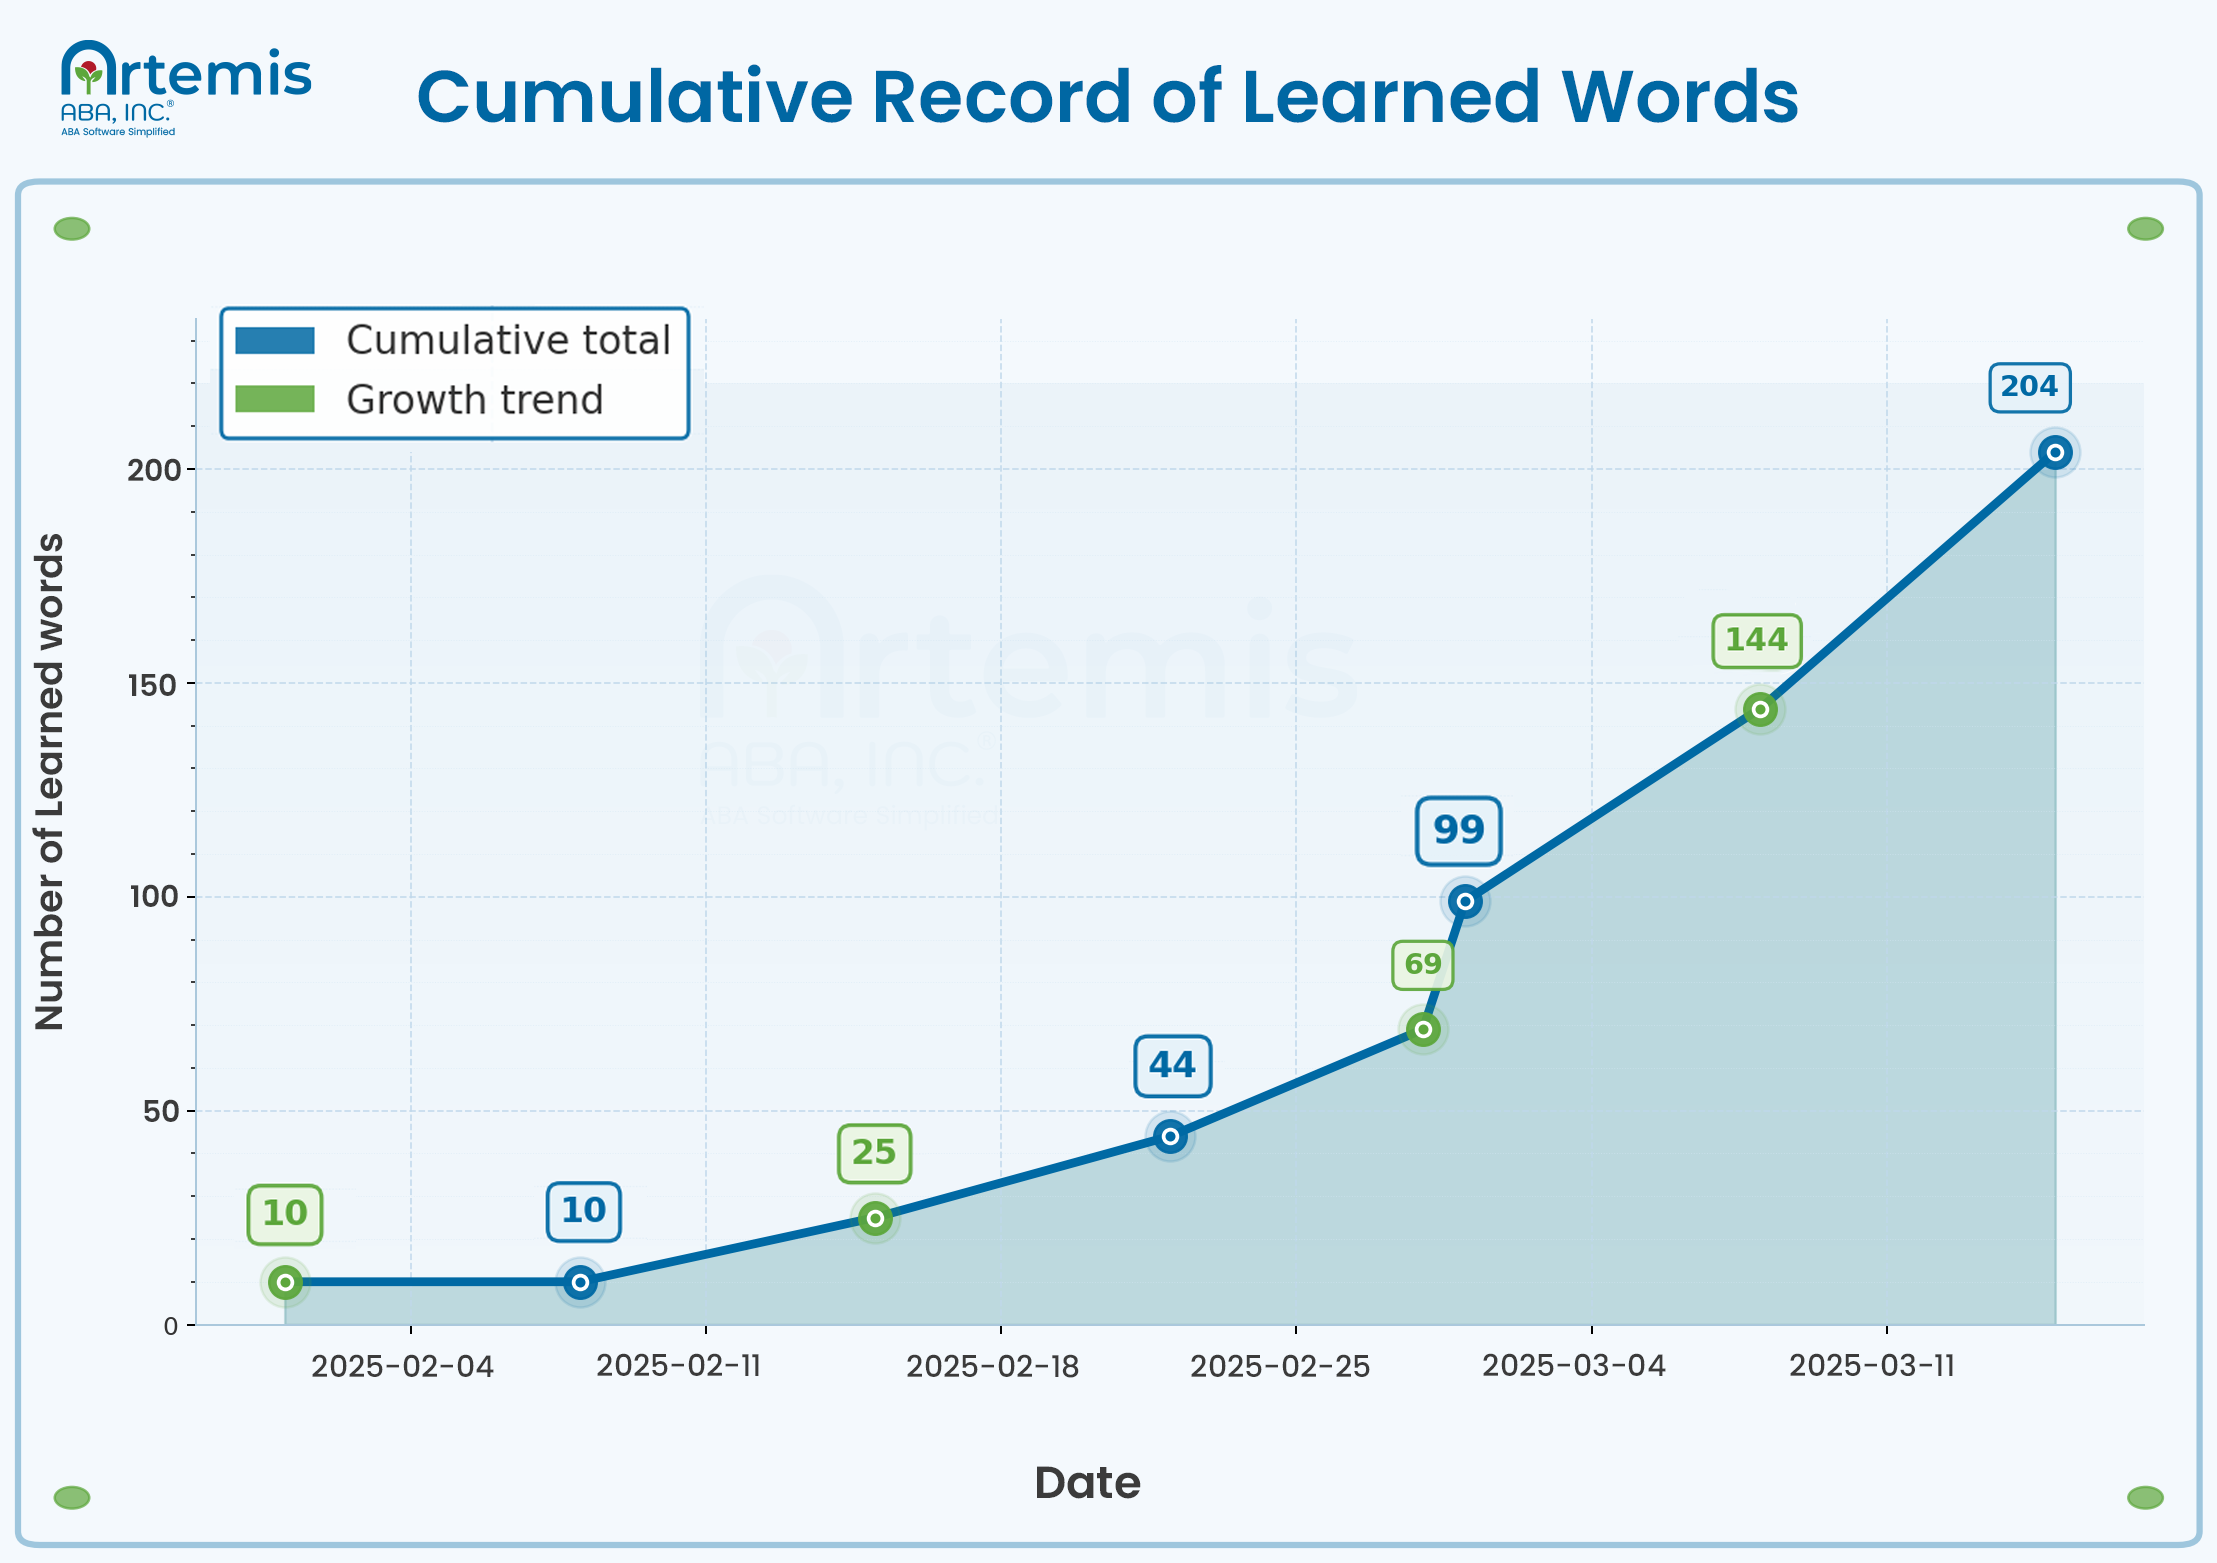
This example shows how many words a learner acquired over a six-week period. The x-axis represents the date that the ABA practitioner collected data, and the y-axis represents the number of learned words. The learner begins with ten words. The flat line in the beginning shows they did not learn any new words during the first week. Then, the consistently positive trend upwards indicates a relatively steady acquisition rate over time. With this type of graph, an ABA practitioner can clearly demonstrate that the learner is gaining new words and specify exactly how many words have been acquired over time.
Cumulative record example showing a learner’s mastered mands
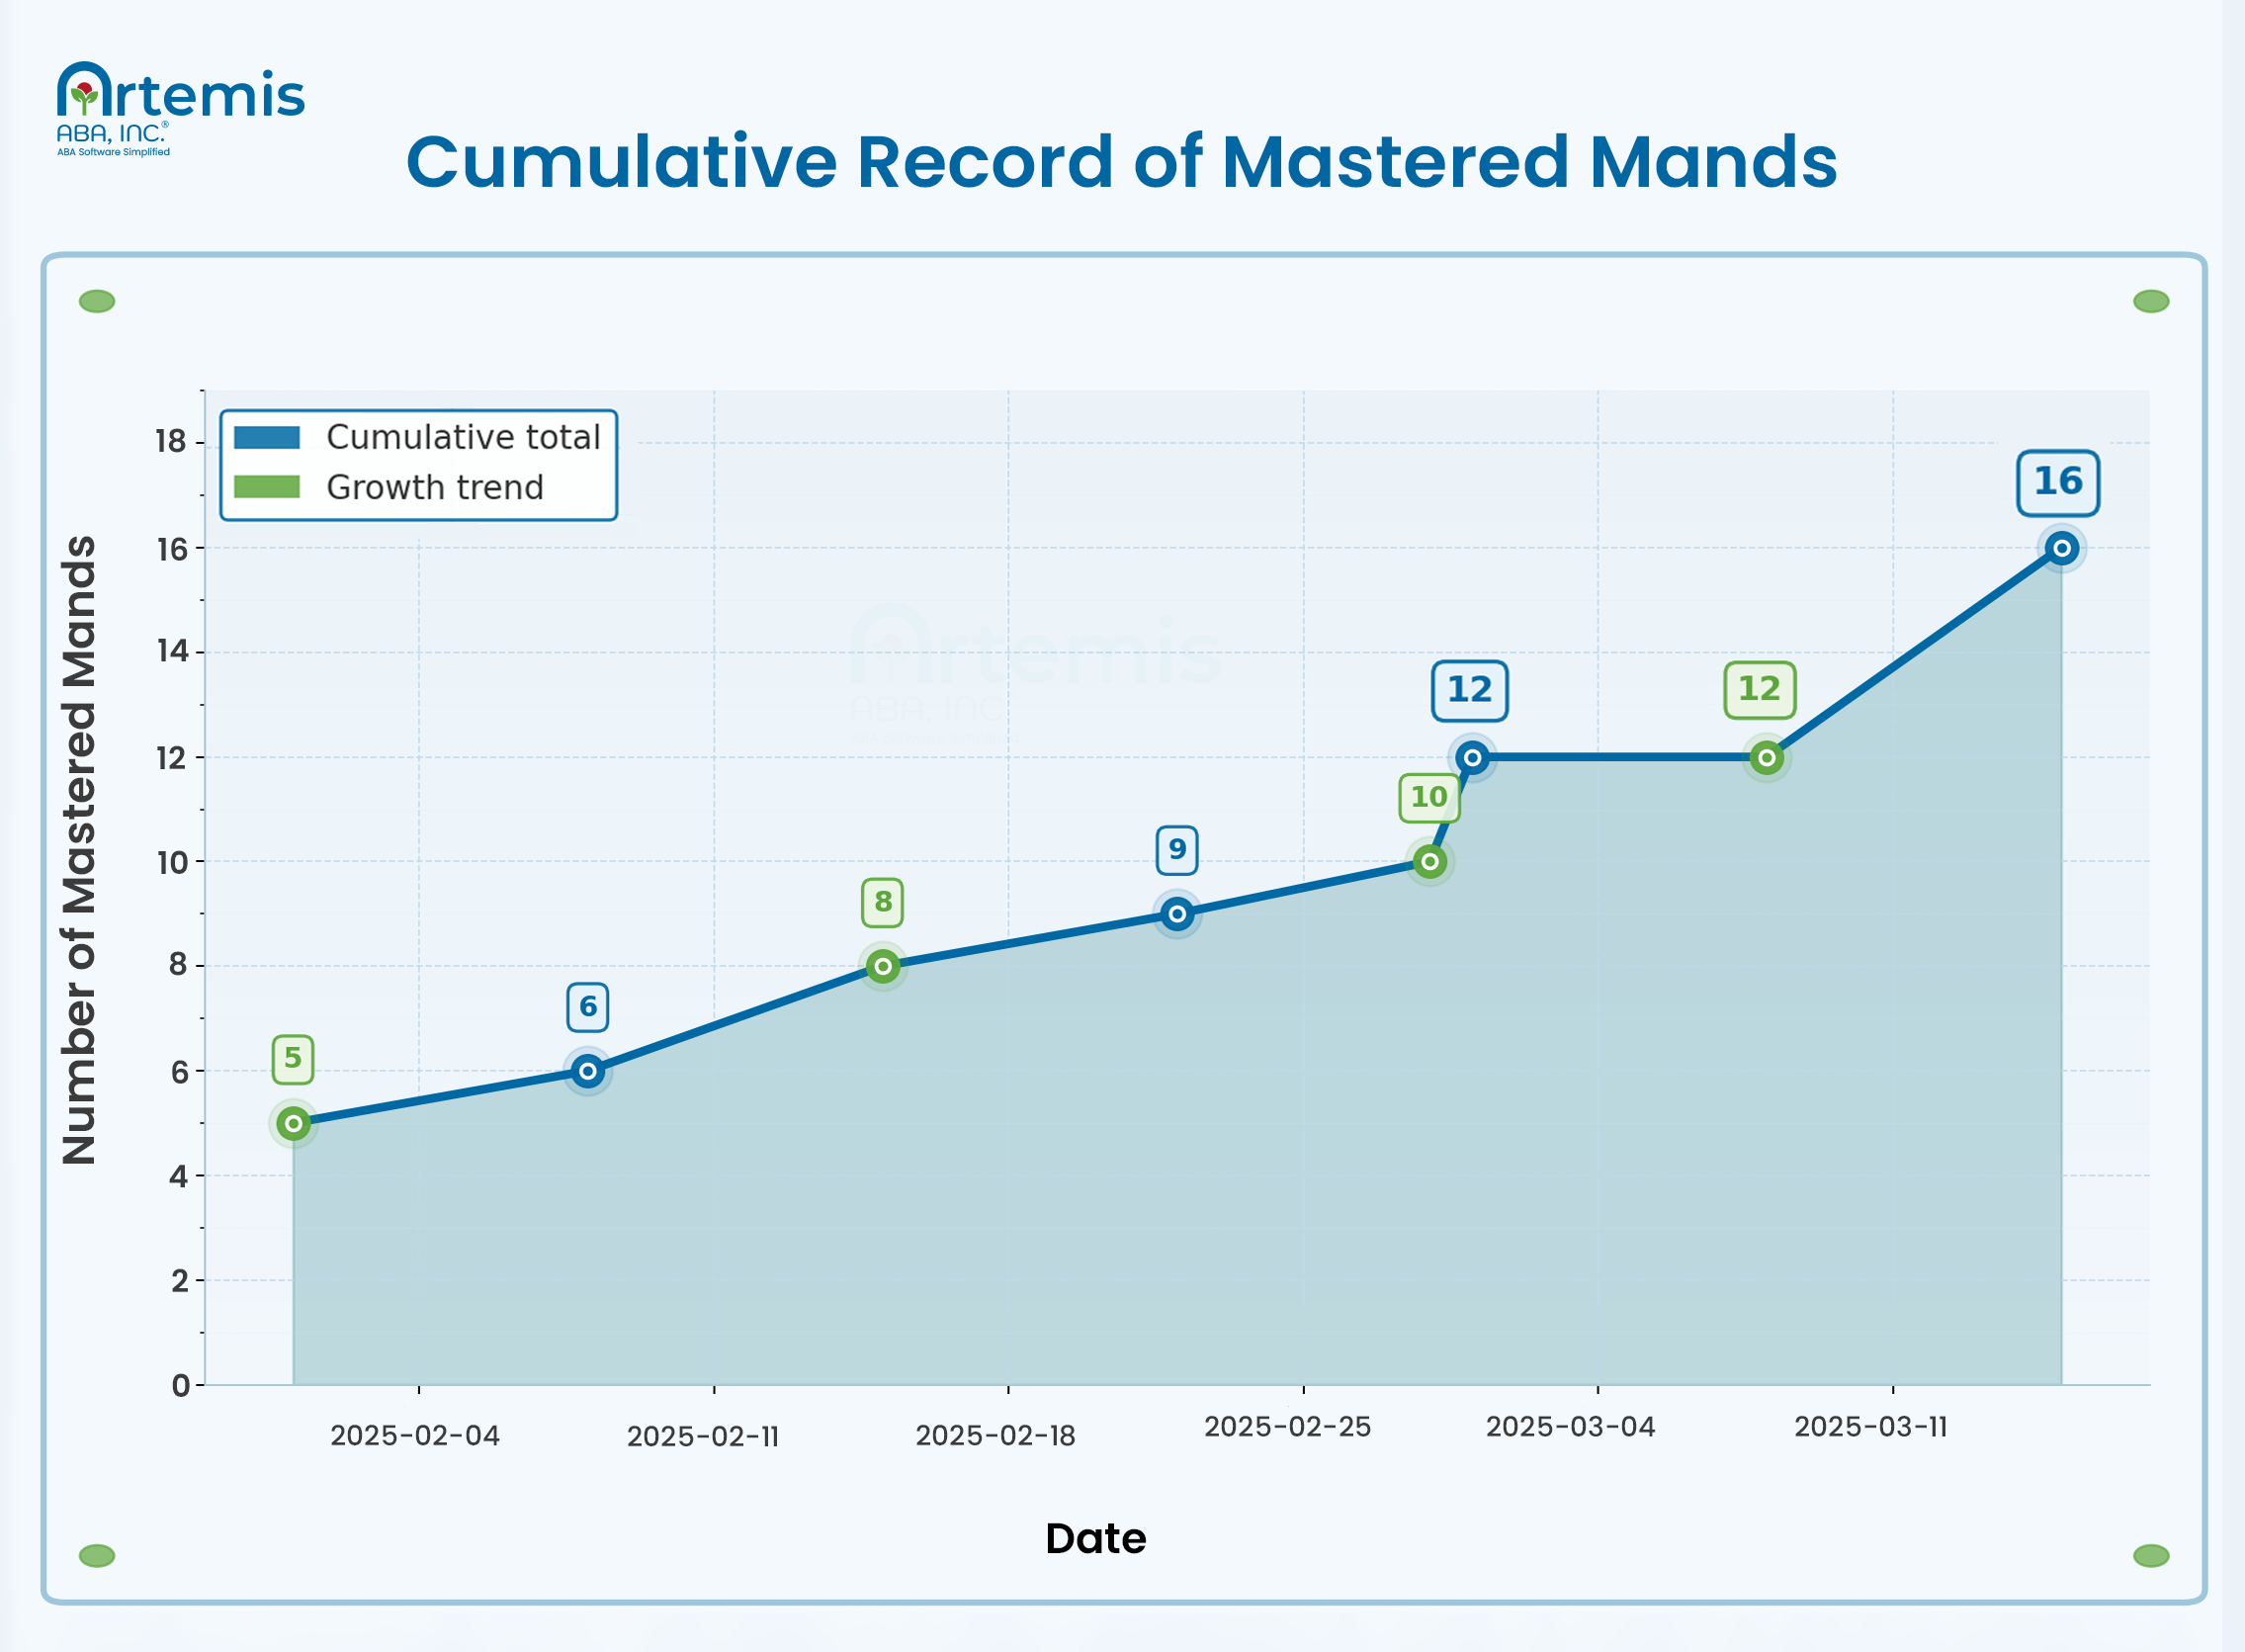
This cumulative record shows how many mands, or ways to make a request, a learner has mastered over time. The x-axis shows the dates data were collected, and the y-axis shows the total number of mastered mands. The upward trend indicates the learner is steadily acquiring new ways to make requests.
ABA cumulative record example showing a running total of all mastered targets
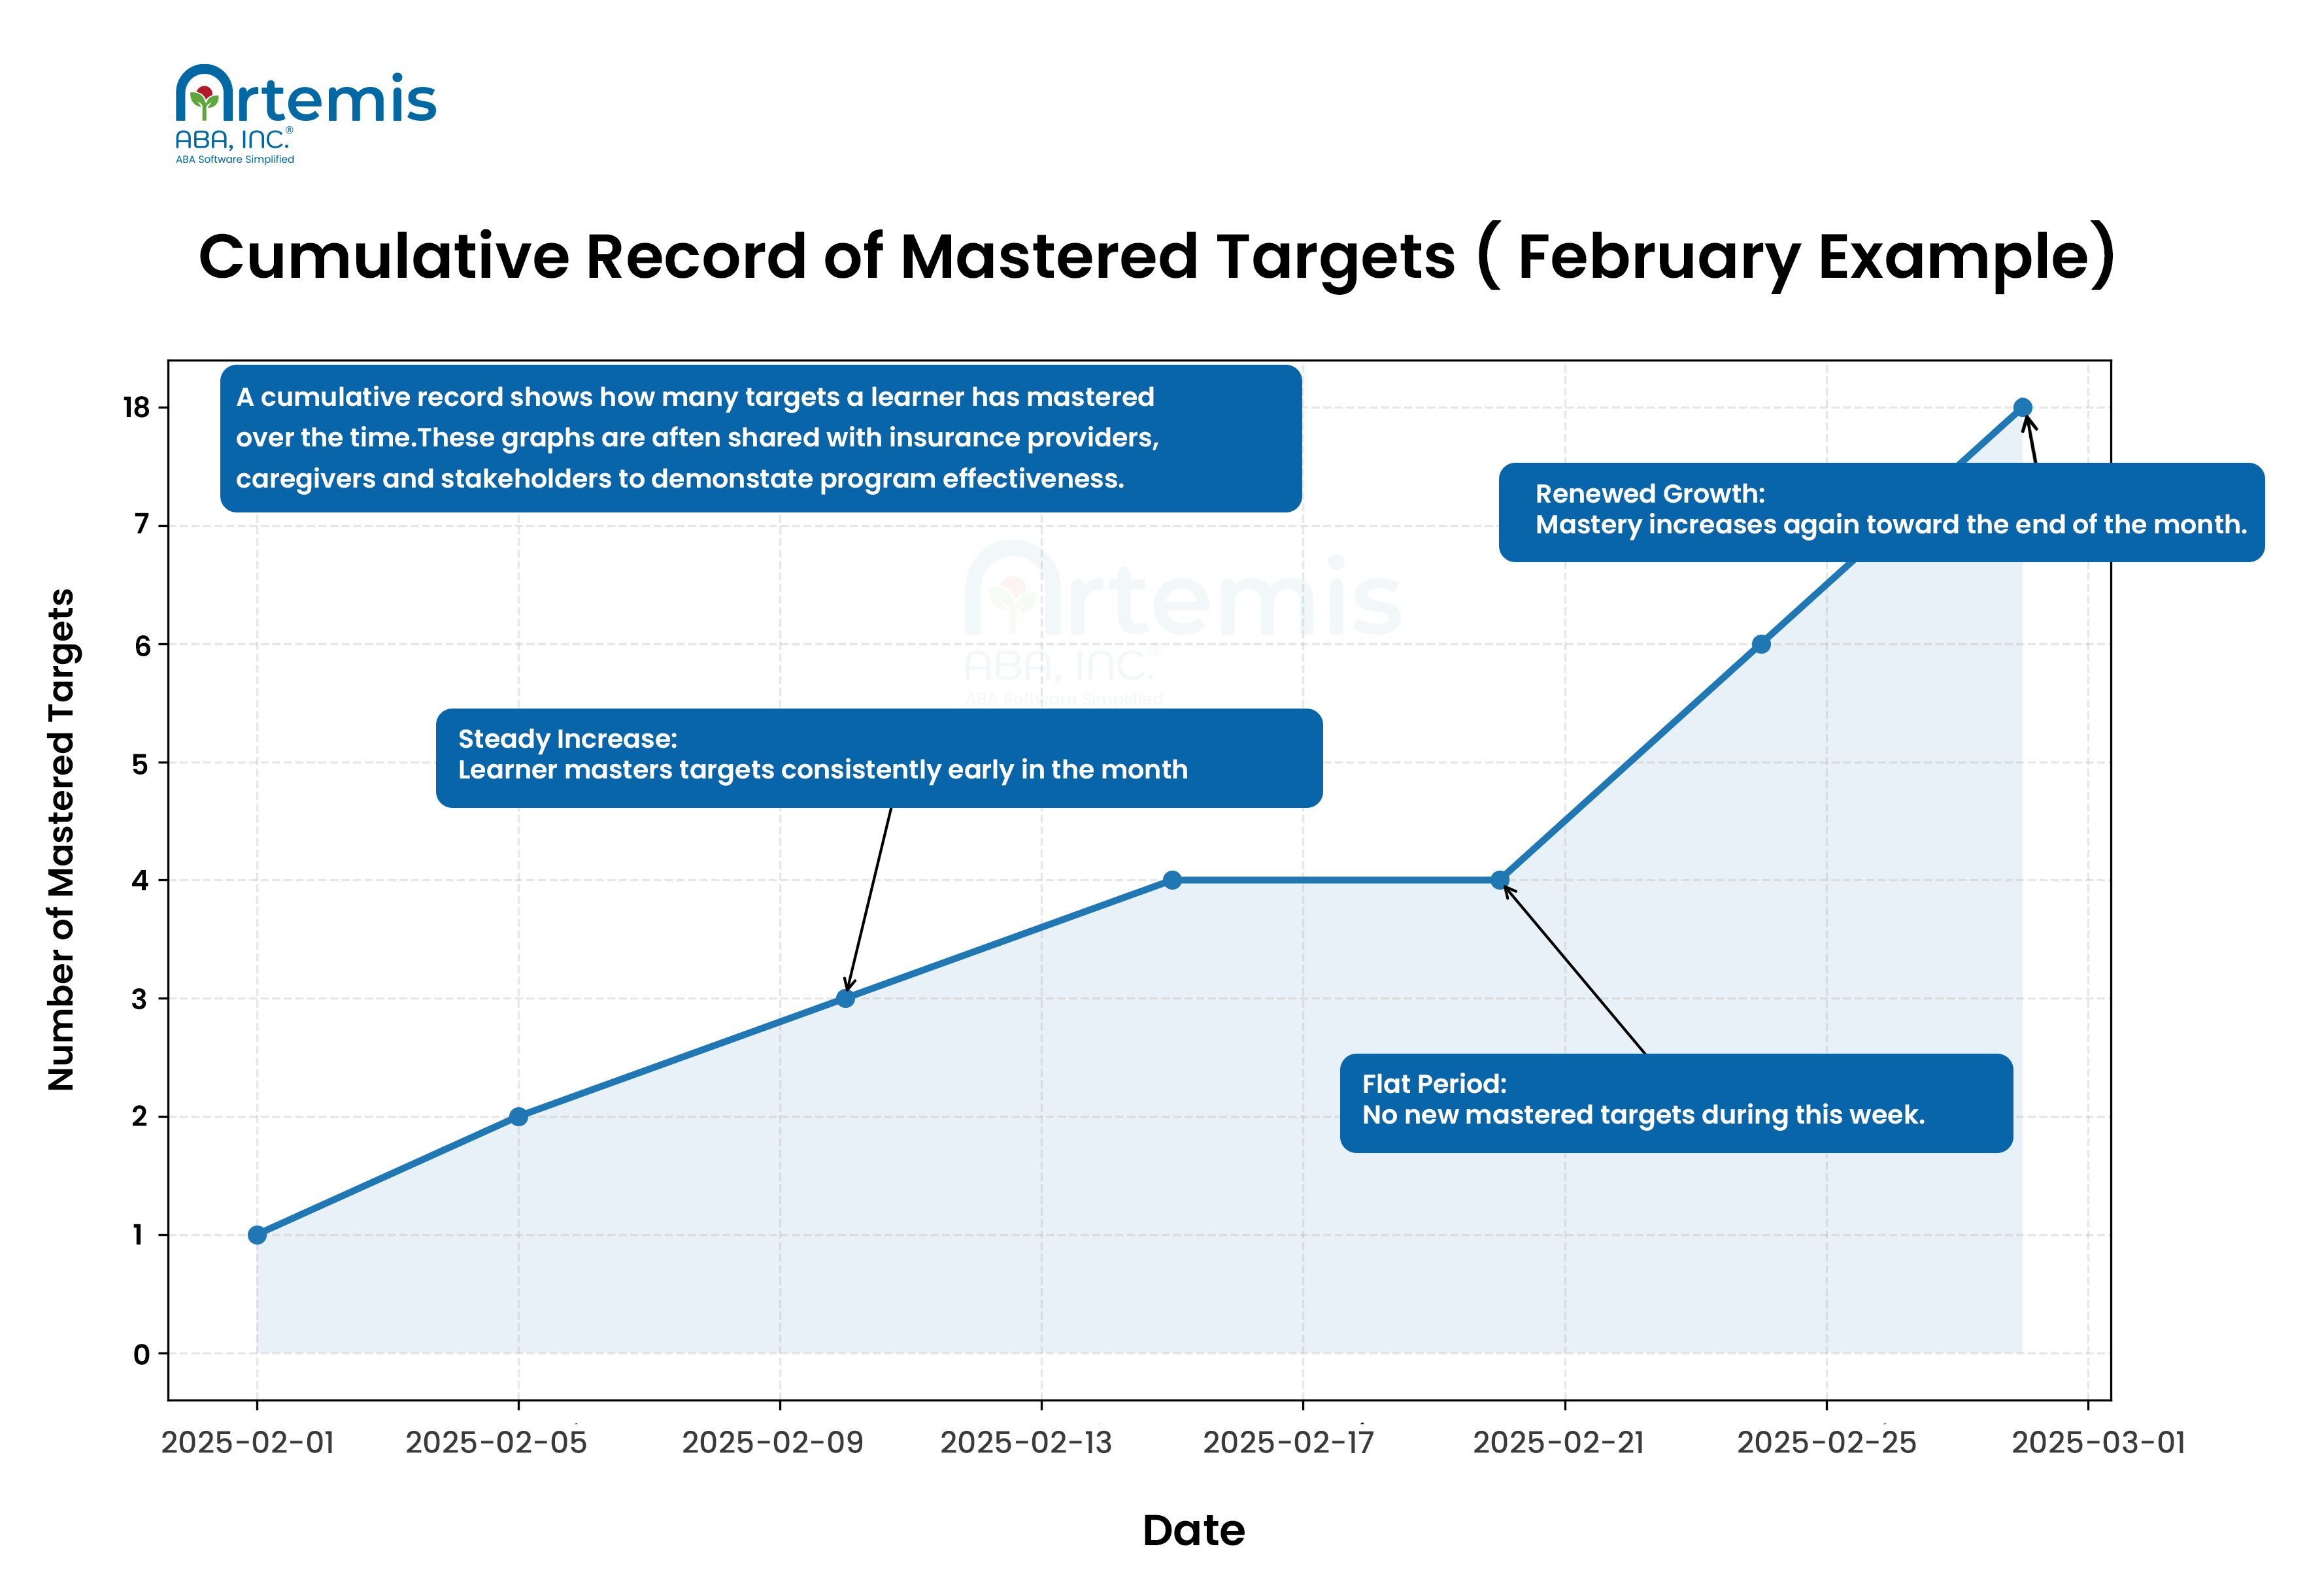
A mastered target cumulative record shows how many targets in a learner’s program have been mastered over a given period of time. In this example, the learner masters eight targets in February. The graph shows a steady increase, followed by a week with no new mastered targets, and then another steady increase.
ABA practitioners often share these graphs with insurance providers, caregivers, and, sometimes, the learners themselves to demonstrate program effectiveness and to monitor how many targets are being mastered over time.
How to implement ABA cumulative recording in your practice
Start by choosing a goal that increases over time, such as mastered targets or new vocabulary words. Set consistent observation periods and record each occurrence. Use data collection software or a simple graph to track the running total. The graph will help you analyze how quickly a learner is mastering a skill, or what their “skill bank” is.
Here’s a step-by-step workflow to start using ABA cumulative recording in your ABA practice:
- Pick the right target: Choose a skill or behavior that you want to build over time (e.g., mastered targets, independent vocabulary, completed steps in a routine). A cumulative record approach won’t work for tracking maladaptive behaviors, for example.
- Define the behavior clearly: It’s always important to have an operational definition of the target behavior so that anyone collecting data will score and assess it the same way.
- Define the measurement targets and mastery criteria: Decide what you’re accumulating, like “total mastered targets,” “total independent uses,” or “total correct responses.” If you’re racking mastery, make sure you have clear mastery criteria for each target.
- Choose your data collection intervals: Have the primary data collector pick a consistent interval that fits your schedule: per session, daily, weekly, or monthly.
- Collect data: Record the count for each interval using your preferred method (e.g., digitally, via software or an app, or on paper). Add it to your previous total (if you’re using digital data collection, check if it will automatically calculate the total for you, or program that function in).
- Plot the cumulative total: Put time on the x-axis (sessions/days/weeks) and the cumulative total on the y-axis. Use software or a simple spreadsheet to automatically populate the graph.
- Interpret the graph: A steeper line means a faster acquisition rate, whereas a flat line means that the learner isn’t progressing. If relevant, note whether the acquisition rate increased, decreased, or showed no response to specific parts of your program interventions, or changes in the learner’s environment. Use what you see to make any adjustments to teaching procedures, prompting, reinforcement, or the target you’re measuring.
- Share results with relevant stakeholders: Review the graph with caregivers, teachers, parents, and, as appropriate, the learner. Use everyday language to explain the learner’s progress and what the graph means.

Kelly Carrero, PhD, BCBA, LBA-TX, and associate professor, emphasizes that sharing data with learners can be valuable, but only when it is developmentally appropriate.
“If I believe a learner is going to grow into adulthood with expectations like employment, relationships, and independence, then self-advocacy has to start early,” she says. “Regardless of why they’ve been referred to ABA, if they are cognitively and verbally capable of that future, I want them actively involved in their own growth. Part of that process is learning to reflect on progress: looking at where you succeeded and where you’re still working.”
At the same time, she cautions against automatically sharing graphs.
“With younger learners in particular, it’s more important to reinforce progress in meaningful ways than to present formal data. We want to motivate them and build skills, not create pressure around performance trends or turn progress into something that feels like ranking or comparison.”
How to use cumulative recording in your ABA practice
How to interpret an ABA cumulative record graph
To interpret a cumulative record, start by identifying your goal. The final data point shows the total number of responses or skills mastered. To evaluate the response rate, examine the slope during a specific period. A steady slope suggests consistent responding, while changes in slope indicate shifts in rate.
“The primary question I’m answering with a cumulative graph is: How quickly is this learner acquiring skills?” says Carrero. “The acquisition rate tells me whether the instructional procedures are effective. If I’m assuming the RBT is implementing the program well and the learner is receiving regular opportunities to respond, then changes in the slope of that graph give me meaningful information about progress.”
To gain insight into a learner’s acquisition rate, examine the slope of the cumulative record. A steeper slope indicates a higher response rate, while a flatter slope indicates a lower rate. The clinical meaning of the slope depends on the time frame under evaluation.
The overall response rate reflects average responding across the entire graph. Practitioners assess it by visually comparing the first and last data points. A steady slope suggests stable performance over time. The local response rate focuses on a smaller segment of the graph. Practitioners examine local rates to identify short-term shifts, such as how a specific intervention affected responding across a few sessions.
Here’s an example cumulative record graph that highlights and explains key elements of the graph to interpret:
How to interpret a cumulative record
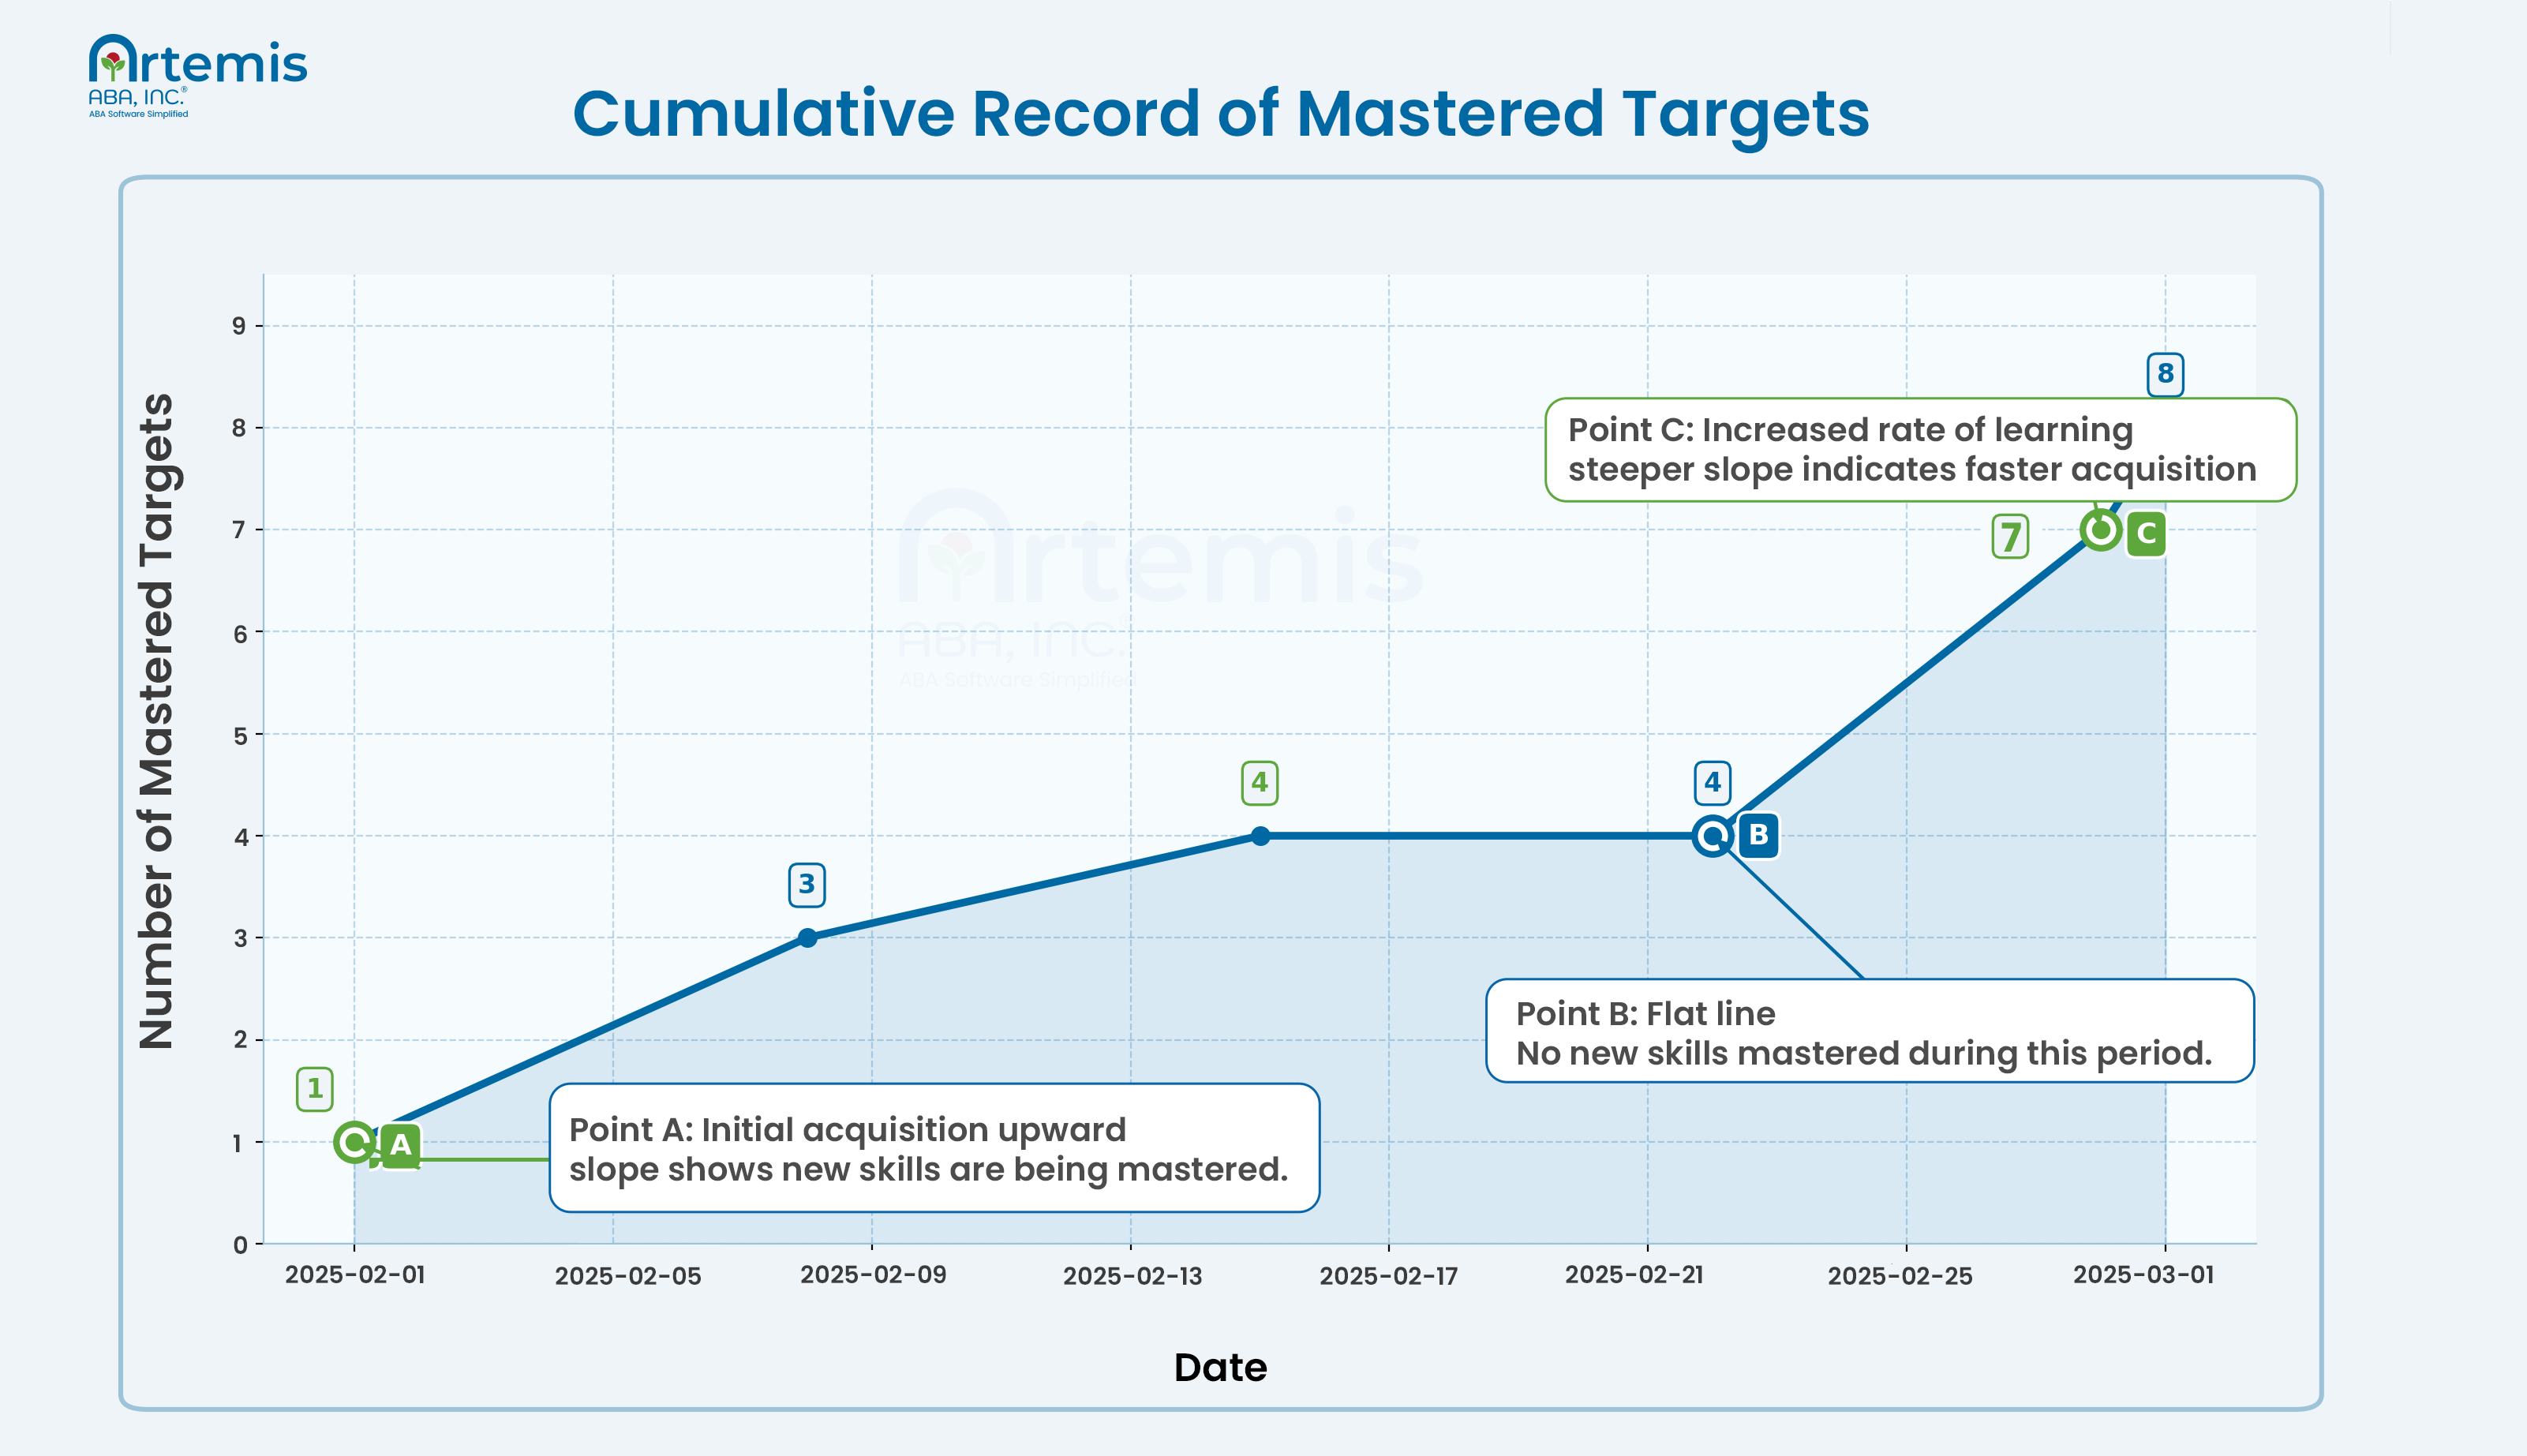
Point A: Initial acquisition: At A, the line begins to rise. This upward slope shows the learner is acquiring new targets. The slope tells us learning is occurring, and its steepness gives us a sense of how quickly skills are being mastered.
Point B: Flat line: At B, the line is flat. A flat line on a cumulative record means that the learner did not master any new skills during that period.
Point C: Increased rate of learning: At C, the slope becomes steeper. A steeper slope indicates a faster rate of acquisition. This change might reflect an effective intervention method, that the learner is more motivated, or that the teaching is more consistent.
[fs-toc-omit]How to explain an ABA cumulative record to parents
Begin by describing what the cumulative record tracks, such as mastered targets or a growing skill set. Explain how the steepness of the line relates to how quickly their child is picking up skills. Frame the graph as a meaningful indicator of their child’s progress.
Here’s a way to explain an ABA cumulative record to parents:
- Start with the big idea
Explain how a cumulative record shows growth over time. You might say, “This graph tracks the total number of skills your child has learned so far. Each time a new skill is mastered, we add it to the total. This total represents your child’s skill ‘bank’ and never goes down.”
Clarify that, unlike some graphs that go up and down each day, a cumulative graph only moves upward or stays flat. It’s important to clarify what a flat line means with positive language like “a flat line means your child didn’t learn anything new during that period, which is normal.”
- Explain how to interpret the line
Next, explain what the line represents. You can try the following prompt: “You’ll notice the line never goes down. That’s because this isn’t about 'good days' or 'bad days'—it’s a record of their permanent achievements. When the line is flat, like right here, it means we were practicing and strengthening current skills. When it shoots up, like here, it shows a burst of new learning.”
You can also point out how you use the graph to adjust their programming. For example, consider: “When we make a change in teaching, such as introducing a new strategy, we mark it on the graph. That helps us see whether the change led to faster progress.”
- Emphasize progress
When speaking with parents, emphasize their child’s progress. Use the cumulative record to point out how each upward step demonstrates skills gained and goals met. Walk them through the graph so they can clearly see the steady growth their child is making over time.
How to read and explain a cumulative record
[fs-toc-omit]Benefits of ABA cumulative records
ABA cumulative records offer many benefits. They provide objective, visual feedback on a learner’s progress. Because they’re easy to interpret, practitioners use them to quickly and effectively show progress to learners, caregivers, and insurance providers. Also, BCBAs can use these graphs to guide data-based treatment decisions.
Here’s a summary of the benefits of using an ABA cumulative record:
- Easy to visually interpret
Cumulative records are easy to interpret. With a quick glance, a BCBA can notice consistent progress, plateaus, or changes in learning rate. These visual patterns are straightforward to read and provide meaningful insight into behavior trends over time.
- Powerful, simple way to communicate growth
Because cumulative records are easy to read and focus on growth over time, BCBAs often use them to communicate progress to caregivers outside the ABA field. A cumulative graph of a specific skill, or of all mastered targets, allows caregivers and learners to step back and see long-term progress. If a learner struggles during a particular period, the graph provides perspective and highlights the growth that has already occurred.
When parents, school teams, or other stakeholders ask, ‘How much progress has the learner made?’ I can show them a visual representation of growth,” says Carrero. “It shifts the conversation from isolated session data to a broader story of skill development over time.”
- Can track step-by-step progress toward a larger goal
ABA professionals also use cumulative records to break a larger goal into smaller, measurable steps and track progress across those steps over time.
Carrero offers an example:
“If a teenager sets a goal to apply for a part-time job, we can break that goal down into specific steps: creating a resume, completing a draft application, practicing interview questions, submitting applications, and attending interviews. When the learner completes a step, we add it to the cumulative total. In this context, the cumulative record acts like a visual roadmap that can motivate the learner and break what might be an overwhelming goal into manageable steps.”
- Can track growth across all ABA programs
Many ABA practitioners use cumulative records to track the number of skills a learner masters throughout a treatment program. By counting each mastered target as a single data point, practitioners convert a wide range of behaviors into consistent, measurable data. This approach allows them to graph diverse skills together and evaluate progress across multiple programs, not just one.
- Offers precise information about quantifiable skills
“When you collect data on a clearly defined target, such as language acquisition, you can state exactly how many words a learner has mastered,” explains Dr. Haas. This level of precision helps in long-term programs. Instead of relying on a general sense that a learner is expanding their vocabulary, you can report the exact number of words in their vocabulary bank.”
- Can help you understand the efficacy of treatment decisions
BCBAs use cumulative records to evaluate how their interventions affect response rate. For example, a BCBA can mark the point on the graph when a new treatment begins. They can then compare the slope before and after the change. If the slope becomes steeper, it suggests the intervention may have increased the learner’s rate of progress.
- Offers insight into programming decisions
While this type of analysis focuses on when behavior changes in relation to a specific treatment adjustment, cumulative data also serve a broader programming function.
“From a programming perspective, cumulative data can guide decision-making,” says Carrero. “For example, if I’ve taught functional play across ten different materials but the learner consistently engages with only one or two outside of structured teaching, that tells me something about the utility of the program. Are we teaching in a way that promotes true engagement, or are we simply meeting mastery criteria without meaningful use?”
[fs-toc-omit]Comparison of ABA cumulative records vs. other graph types
Cumulative records differ from other graphs in several important ways. They display the accumulated total of responses rather than session-by-session performance. They also often span weeks or months and are useful for answering questions about long-term skill acquisition. Visually, they are different because the line never slopes downward.
Cumulative records are one of several foundational graphs in ABA, alongside line graphs, scatterplots, and bar graphs. Some behavior analysts also use the Standard Celeration Chart (SCC) as part of a methodology called “Precision Teaching.” The SCC focuses heavily on changes in response rate over time but uses a very complex visual format. Today, the SCC is relatively uncommon in everyday clinical ABA practice. For that reason, this article focuses primarily on cumulative records and standard line graphs.
Since cumulative records often appear as line graphs, it is easy to assume they are the same thing. However, a line graph is simply a visual tool for displaying data, while a cumulative record is a specific data pattern. In ABA, most cumulative records are a line graph, but not every line graph is a cumulative record.
Cumulative records are the best choice when (1) the behavior or skill is discrete, occurs relatively often, and is something you want to increase, and (2) you are interested in the running total of that behavior over a long period of time.
In contrast, clinicians choose line graphs when they want to examine changes within individual sessions or compare phase changes more directly. They may use scatterplots to identify patterns across time of day or environmental variables. Bar graphs work well when comparing categories or summarizing data points. Each graph serves a different purpose, but cumulative records provide a distinct advantage when the goal is to track total growth over time.
Here’s how cumulative records differ from other ABA graphs:
- The data points accumulate
The defining feature of a cumulative record is that it plots the running total of a variable over time. Each data point builds on the previous one, so the graph reflects total growth rather than isolated performance.
In contrast, line graphs and scatterplots can move up or down because they display session-by-session performance. For example, if a student learns fewer new words during one session than in the previous session, a line graph, scatterplot, or bar graph would show a downward shift. A cumulative record would not drop; instead, the slope would become less steep.
- The slope never goes down
Because a cumulative record graphs a running total, each new data point is equal to or higher than the one before it. The value never decreases. As a result, the slope—or steepness—of the line never trends downward.
In contrast, data points can increase or decrease from one session to the next in line graphs, scatterplots, or bar graphs. For example, if a student learns three words in one session and two words in the next, a cumulative record would show an increase from three total words to five total words (3 + 2). In contrast, a standard line graph or scatter plot would display “3” for the first session and then a lower value of “2” for the second session.
- The variable is always countable
To use a cumulative record, the variable must be discrete and countable. A discrete behavior has a clear beginning and end, allowing the practitioner to count each occurrence and add it to a running total. It should also represent something that meaningfully accumulates over time—typically a skill or behavior you want to increase. Examples include correct responses, mastered targets, completed trials, or independent mands.
Cumulative records are less suited to ABA continuous measures such as duration, latency, or intensity. Although you can technically total these measures across sessions, the accumulated value often does not answer the most relevant clinical question.
- The variable is something you want to increase over time
ABA clinicians use cumulative records to plot variables they expect to increase over time. These graphs do not work well when the goal is to reduce a maladaptive behavior.
You could graph the total number of aggressive incidents across a treatment period, but the cumulative line would continue to rise as long as incidents occur, even if the learner shows fewer incidents each week. Because the line never moves downward, it does not clearly show reductions in behavior. Clinicians usually choose a session-by-session frequency or rate graph when they want to evaluate decreases in behavior.
[fs-toc-omit]How to decide when to use ABA cumulative records vs. line graphs
Use the graph that best answers your clinical question and aligns with your treatment goal. Choose a cumulative record to track the running total of a measurable variable over time. Choose a line graph when you want to examine session-by-session performance or plot variables such as duration and latency.
Cumulative records and standard line graphs serve different purposes. A cumulative record works best when you want to show long-term growth in a discrete, countable skill. A line graph works best when you want to evaluate what happened within each session and make instructional decisions based on variability, trends, or immediate performance.
Use the following questions to decide whether an ABA cumulative record or a line graph is best for your project:
- Are you interested in long-term accumulation or session performance?
If you want to see the running total of progress across weeks or months, use a cumulative record. The resulting graph will highlight trends in learning skills, such as mastered targets or total correct responses.
If you want to know how the learner performed in a specific session, or whether performance improved from one session to the next, use a line graph. Line graphs clearly show day-to-day changes, trends, and variability.
- What instructional format are you using?
In Discrete Trial Training (DTT), clinicians often collect data on percent correct across a fixed number of trials. In this case, a line graph showing percentage correct per session usually provides more useful information than a cumulative count of correct responses. Percent correct shows acquisition, error patterns, and readiness for mastery criteria. A cumulative graph may work better at the program level (e.g., total targets mastered) than at the individual trial level.
- Does the accumulated total answer your clinical question?
If the total number over time is meaningful (for example, total mastered targets this quarter), a cumulative record works well. If you care more about how the learner performed today, such as the percent correct of daily responses, the duration of on-task behavior, or latency to respond, a line graph will be easier to interpret.
- Are you trying to increase or decrease the behavior?
When the goal is to reduce a behavior, a session-by-session graph clearly shows decreases, trends, and variability. A cumulative graph, by contrast, continues to rise as the behavior occurs, which makes reductions more difficult to interpret.
How to create an ABA cumulative record in Excel
ABA cumulative record tracking sheet in Excel
Our free ABA cumulative record tracking sheet automatically calculates the cumulative total from your daily counts and generates a cumulative record graph. The template handles the calculations and graphing, so you can focus on collecting data and interpreting results.
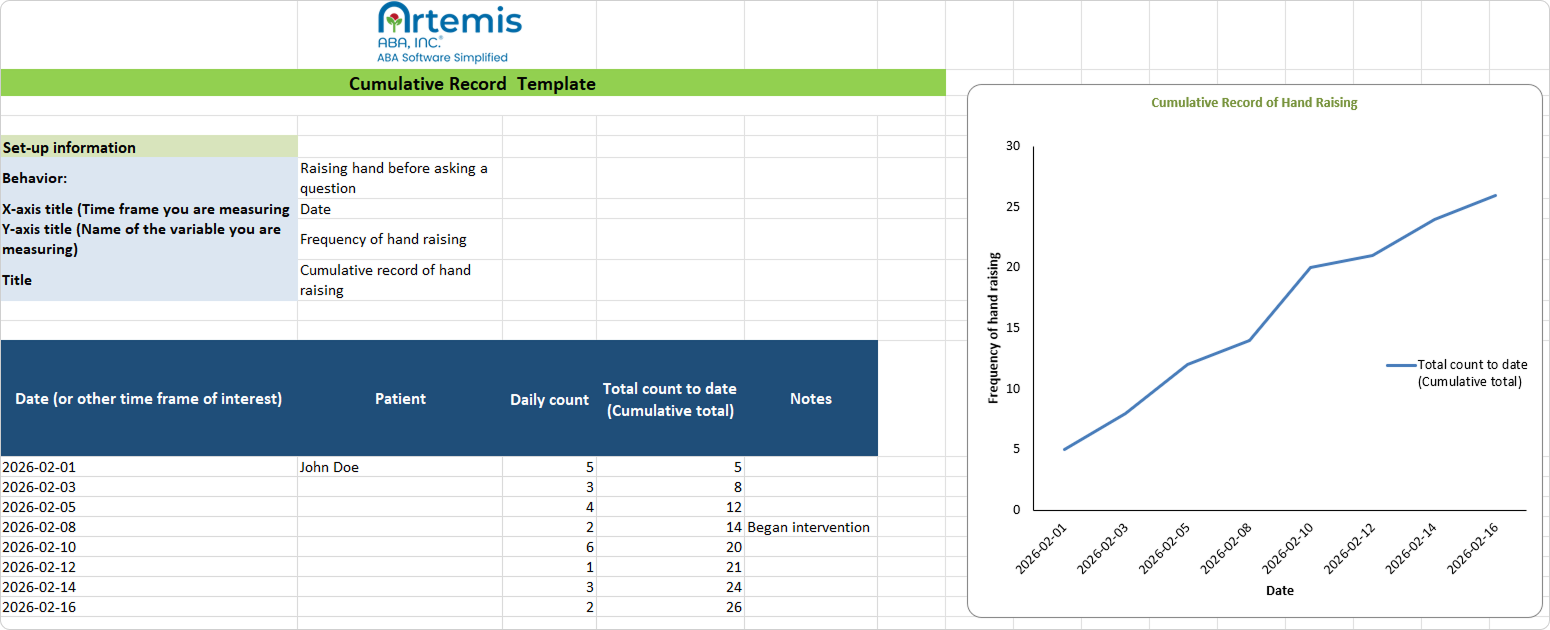
Download our ABA Cumulative Record Template and start visualizing your data today.
How the math works: The idea behind cumulative records is simple: Each new total equals the current value plus all previous values. In mathematical terms, if x represents the current value and y represents the cumulative total, then: y = x + (sum of all previous x values).
Although the logic is straightforward, calculating it manually can be tiring, and setting up the correct Excel formula can take some effort. The extra work, though simple, can be tedious and lead to clinical charting errors that may affect your decision-making down the line.
That’s where the template helps by performing the calculation automatically. You simply enter your data, and the cumulative totals update on their own.
[fs-toc-omit]Using software for ABA cumulative records
Today, more and more ABA practitioners rely on software to collect data and generate cumulative records. Instead of manually graphing results or using spreadsheets, digital platforms automatically calculate and graph cumulative totals.
This software streamlines data collection, reduces calculation errors, and allows practitioners to focus more on analysis and decision-making.
Over the last several decades, ABA has increasingly adopted digital systems that automate time-consuming tasks such as data collection and graphing. Today, most practitioners use digital tools like Microsoft Excel or specialized ABA software to collect and graph data.
An increasing number of ABA practices use advanced cloud-based platforms, also called Software as a Service (SaaS) systems, to collect data and generate cumulative records. Instead of installing programs on a local computer, clinicians access these platforms securely through the internet. The system automatically calculates cumulative totals and updates graphs in real time. Because ABA involves protected health information, reputable platforms maintain HIPAA compliance by following federal privacy and security standards that safeguard client data.
With these tools, clinicians simply record the variable of interest for the day, whether it’s the number of words a child has acquired or the number of correct responses during a session. Usually, the clinician directly enters the data directly into an ABA software or a spreadsheet, rather than transferring it from paper to a digital software. The program then adds the daily count to the previous total, creating a running cumulative record over time. Many platforms also include built-in graphing features that automatically update the visual display.
This shift toward digital systems in ABA offers several advantages. First, it reduces calculation errors. Greater accuracy improves long-term tracking and supports more precise data-based decisions that can meaningfully impact the learner’s progress. When clinicians do not need to manually total responses or create graphs, they save time that they can devote to programming, working with learners, and analyzing data.
Modern ABA software also supports data integration through secure APIs (Application Programming Interfaces). This means session data, billing systems, and reporting tools can communicate with each other, reducing duplicate entry and minimizing errors.
How Artemis ABA streamlines cumulative records
Artemis ABA takes digital cumulative records a step further by removing the extra steps that often come with spreadsheets or manual graph setup. Clinicians enter session data directly into the platform, and Artemis automatically calculates the cumulative total and generates the graph. Teams can spend less time managing data and more time analyzing progress.
Among ABA software platforms, Artemis ABA represents the next step in digitizing clinical data. Instead of entering session data in one system and managing cumulative calculations in another, clinicians record data directly within the platform, and Artemis automatically generates the cumulative total and corresponding graph.
It begins with the clinician dashboard, which provides an overview of each learner, including target progress and behavioral trend analysis. From this dashboard, Artemis pulls session data to create a cumulative record of mastered targets with a single click—no additional data entry or spreadsheet management required.
Within the cumulative record view, you can see both the running total and the number of targets mastered in each session. If you want to examine a specific skill or behavior more closely, you can access the supporting data table directly within the platform.
Schedule Your Walkthrough

ABA cumulative recording FAQs
Find answers to commonly asked questions about ABA cumulative records. Learn about how cumulative recording began in the field, how it relates to key ABA concepts, and more.
What’s the difference between a mechanical cumulative recorder and modern methods?

A mechanical cumulative recorder is a physical device that uses paper and moving pens to track responses and create a cumulative graph. Psychologist B.F. Skinner invented it and used it in early behavior analysis studies. Today, practitioners use digital software to record, graph, and analyze data in real time.
Did B. F. Skinner invent cumulative recording?
B. F. Skinner did not invent the general idea of tracking running totals, but he designed his own mechanical cumulative recorder and made it central to behavioral research. His work strongly shaped how cumulative records are used and understood in modern behavior analysis.
How did cumulative records support early behavior analysis?
In his 1938 book The Behavior of Organisms, Skinner used cumulative records to demonstrate core principles such as the Law of Effect, steady-state responding, and the discriminated operant. These visual records helped researchers observe consistent response patterns under controlled experimental conditions.
What is the Law of Effect in ABA?
The Law of Effect explains that reinforcement increases the likelihood a child will repeat a behavior, while unpleasant consequences decrease the likelihood the behavior will occur again. In ABA, practitioners apply this principle to shape learning. Cumulative records show how reinforcement changes response rates over time.
What is steady-state responding in behavior analysis?
Steady-state responding refers to a stable and consistent pattern of behavior under constant conditions. When reinforcement schedules remain the same, response rates level out and follow a predictable pattern. Cumulative records made these stable trends visible by showing consistent slopes over time.
What is the temporal locus of behavior in ABA?
In ABA, the temporal locus of behavior describes the specific point in time when a behavior happens in relation to events that happen before and after it. ABA practitioners look at what happens right before the behavior (the antecedent) and what happens right after (the consequence) to understand why it occurs.
Monday to Friday, 7 AM – 7 PM CST.
If you're reaching out outside these hours, please submit a support ticket—our team will respond as soon as possible.


%201.webp)